|
Author
|
Topic: 5 Lies Being Told In The National Debt Debate
|
AcousticGod
Knowflake Posts: 5510
From: Pleasanton, CA
Registered: Apr 2009
|
 posted July 26, 2011 04:55 PM
  
Just for fun I went to find the actual chart, Jwhop. Here it is: 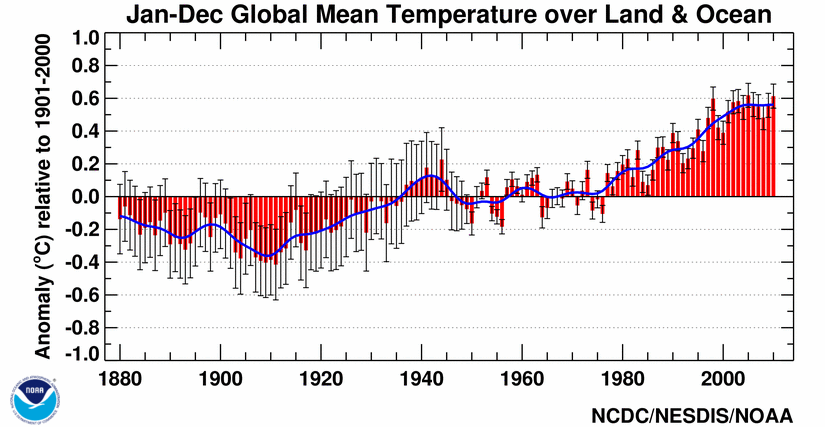 http://www.ncdc.noaa.gov/cmb-faq/anomalies.php http://www.ncdc.noaa.gov/cmb-faq/anomalies.php IP: Logged |
Randall
Webmaster Posts: 10251
From: The Goober Galaxy
Registered: Apr 2009
|
 posted July 26, 2011 05:34 PM
AG, you don't recall citing Wikipedia and then me calling you on it after you had lambasted me on it and you then stating that there's nothing wrong with Wikipedia as a source?  ------------------
"To avoid criticism, say nothing, do nothing, be nothing." Aristotle IP: Logged |
Randall
Webmaster Posts: 10251
From: The Goober Galaxy
Registered: Apr 2009
|
 posted July 26, 2011 05:41 PM
These nations were duped, just like we have been, but we are wising up. That's not proof of anything, although it's sad. A one degree increase in temperature is hardly a crisis, and anyone who thinks so is foolish. And the bilion-dollar money machine rolls on...------------------
"To avoid criticism, say nothing, do nothing, be nothing." Aristotle IP: Logged |
AcousticGod
Knowflake Posts: 5510
From: Pleasanton, CA
Registered: Apr 2009
|
 posted July 26, 2011 07:31 PM
There isn't anything inherently wrong with citing Wikipedia as I mentioned earlier in this thread I believe. Wikipedia articles are often well-cited with the publication the article-author got the info from. Wikipedia, though, can only be considered a distraction from the point of the debate, however. As I've pointed out repeatedly in this interaction anyone looking in any reasonable place for climate information will find all the major institutions in agreement. That's indisputable. The ONLY thing that can reasonably be called "foolish" in this debate is the contention that it's a hoax of some sort. Citing a one degree Celcius change as not cause for alarm contradicts professional scientific opinion worldwide. It's astounding the resistance to what's globally accepted by the scientific community. I can't fathom taking such a position, and if I did, I certainly wouldn't engage in debate about it. IP: Logged |
jwhop
Knowflake Posts: 3921
From: Madeira Beach, FL USA
Registered: Apr 2009
|
posted July 26, 2011 08:09 PM
Whassa matter acoustic. Can't you read?The chart I posted specifically says it "represents absolute global (NCDC) temperature change by decade. And, cites NOAA as a source. Man made global warming nuts are on a fools errand. They establish a baseline temperature of 0.0 for years after earth just came out of the Little Ice Age. Anyone with a lick of common sense would know temperatures are going to rise...or we wouldn't be out of the Little Ice Age. These nuts have no concept of the terms "Mean" or "Regression to the Mean". Neither do you acoustic...or you would know your chart is useless in proving your point. The mean temperature is the point where half the temperature points are below the mean line and half are above. In this case, the nuts established a baseline of 0.0 just at the end of the Little Ice Age in 1880. How convenient to say 1880 is the year in which "normal" temperatures occured, but for any scientific purpose, it's trash. Further acoustic, your chart does not show 1934 as the warmest year on record in the 20th Century and it very clearly was. I wonder if the nutty fraud James Hansen had anything to do with producing your chart. Hansen caught peddling phony data AGAIN! An example of the Y2K discontinuity in action (Source: NASA Goddard Institute for Space Studies)Years of bad data corrected; 1998 no longer the warmest year on record My earlier column this week detailed the work of a volunteer team to assess problems with US temperature data used for climate modeling. One of these people is Steve McIntyre, who operates the site climateaudit.org. While inspecting historical temperature graphs, he noticed a strange discontinuity, or "jump" in many locations, all occurring around the time of January, 2000. These graphs were created by NASA's Reto Ruedy and James Hansen (who shot to fame when he accused the administration of trying to censor his views on climate change). Hansen refused to provide McKintyre with the algorithm used to generate graph data, so McKintyre reverse-engineered it. The result appeared to be a Y2K bug in the handling of the raw data. McKintyre notified the pair of the bug; Ruedy replied and acknowledged the problem as an "oversight" that would be fixed in the next data refresh. NASA has now silently released corrected figures, and the changes are truly astounding. The warmest year on record is now 1934.  1998 (long trumpeted by the media as record-breaking) moves to second place. 1921 takes third. In fact, 5 of the 10 warmest years on record now all occur before World War II. Anthony Watts has put the new data in chart form, along with a more detailed summary of the events. 1998 (long trumpeted by the media as record-breaking) moves to second place. 1921 takes third. In fact, 5 of the 10 warmest years on record now all occur before World War II. Anthony Watts has put the new data in chart form, along with a more detailed summary of the events.
http://www.dailytech.com/Blogger+finds+Y2K+bug+in+NASA+Climate+Data/article8383.htm IP: Logged |
AcousticGod
Knowflake Posts: 5510
From: Pleasanton, CA
Registered: Apr 2009
|
posted July 26, 2011 09:05 PM
Can we step into reality for a second, Jwhop? Why would the NOAA say that this previous decade is the warmest on record when it itself had proven otherwise? That would be ridiculous, and retarded as AG is want to say. Clearly the NOAA doesn't believe 1934 was the warmest of the century, and that is represented in my chart, which [unlike you] I actually linked to (anyone can see that it's clearly from the NOAA, and not anywhere else).As is typical with you, you don't understand the chart you posted. If your chart shows change over time, then every change in the positive direction is a change from the previous decade's temperature. 1939 was .3 degrees Celcius higher than 1929. 1949 took back some of that change. Every subsequent decade only added to the temperature with NONE declining. So that's .14 plus .02 plus .05 plus .06 plus .19 plus .13. That's .59 cummulatively. But that's IF your chart is even correct. I know my chart is. I know where it came from. quote:
In this case, the nuts established a baseline of 0.0 just at the end of the Little Ice Age in 1880. How convenient to say 1880 is the year in which "normal" temperatures occured, but for any scientific purpose, it's trash.
Once again, your inability to understand charts shines through. My chart didn't choose an arbitrary mean temperature based on a "Little Ice Age" (What nonsense!). No, my chart clearly says, "Anomaly (*C) relative to 1901 - 2000," which means that the mean temperature is the average temperature of the whole record from 1901 to year 2000. That means from 1880 through the 1940's the global temperature was lower than the mean temperature for the entire 20th century. In the year 1934, America had a hot year. America. That's all. Not the world. Not the globe. Not the planet. Just America, the U.S. of A. You've chosen yet another localized weather event as proof of your position. You guys make a mockery of any remotely scientifically curious person. I'm still dumbfounded by the attempt at debate here. For anyone interested in a whole page of charts by the NOAA, go here: http://www.climate.gov/#understandingClimate/factSheets Set the timeline back to 1880, and look at the results. It's all rather emphatic and in your face. Temperature increase, CO2 increase, ocean temperature increase, sea level increase, Artic sea ice DEcrease. IP: Logged |
jwhop
Knowflake Posts: 3921
From: Madeira Beach, FL USA
Registered: Apr 2009
|
 posted July 27, 2011 12:28 AM
I suppose they would say that acoustic because the fraudster James Hansen is involved.But, Hansen has been caught prostituting climate science far too many times for any rational person to rely on a word he says...or chart he produces. You may well be the very last human left who doesn't get it. How does it feel? One other thing acoustic. Don't you know the difference between "average temperature" and "mean temperature"? "No, my chart clearly says, "Anomaly (*C) relative to 1901 - 2000," which means that the mean temperature is the average temperature...."acoustic IP: Logged |
AcousticGod
Knowflake Posts: 5510
From: Pleasanton, CA
Registered: Apr 2009
|
posted July 27, 2011 09:51 AM
Don't be silly. The last person who doesn't get it couldn't possibly be me. I've only quoted science. With or without Hansen the science is unquestionably on my side. You guys have been trying to find a way to beat this dead horse for more. It's over. It's been over. quote:
One other thing acoustic. Don't you know the difference between "average temperature" and "mean temperature"? "No, my chart clearly says, "Anomaly (*C) relative to 1901 - 2000," which means that the mean temperature is the average temperature...."acoustic
Yes, I do, and I accurately portrayed it. The mean temperature is an average, and the average they used was stated. It was not as YOU stated. IP: Logged |
jwhop
Knowflake Posts: 3921
From: Madeira Beach, FL USA
Registered: Apr 2009
|
posted July 27, 2011 10:34 AM
The people you quote are the faux scientists of the man made global warming hoax acoustic.They have been thoroughly discredited in the scientific community...by their own unscientific methods..which include manipulation of data to produce their "desired" result and...lying about their results and methods and/or hiding the data they used so they can't be called out by real scientists. But, their computer models of climate don't work and didn't and don't predict "actual" temperature trends. Useless junk from junk scientists with an agenda. IP: Logged |
AcousticGod
Knowflake Posts: 5510
From: Pleasanton, CA
Registered: Apr 2009
|
posted July 27, 2011 11:19 AM
Wow, grasping at straws now, huh? No, the NOAA is not at all discredited. It is our nation's premier climate-watching scientific entity, and it's squarely in the global warming camp. This is the entity your grandkids would look to amongst others for information about the climate if they were doing a report on the climate. You can save the posturing for someone like Randall, who enjoys entertaining nonsense as reality. IP: Logged |
katatonic
Knowflake Posts: 6786
From:
Registered: Apr 2009
|
posted July 27, 2011 01:27 PM
posted by eric francis (planet waves) on FB this morningPOLITICO Breaking News House Republicans are calling for the firing of a top staffer at the conservative Republican Study Committee after he was caught sending emails to conservative groups urging them to pressure GOP lawmakers to kill the deficit plan proposed by Speaker John Boehner. The opposition from the right is the latest sign of deep divisions within the Republican party over how to handle the debt crisis.
IP: Logged |
katatonic
Knowflake Posts: 6786
From:
Registered: Apr 2009
|
posted July 27, 2011 01:29 PM
posted by eric francis (planet waves) on FB this morningPOLITICO Breaking News House Republicans are calling for the firing of a top staffer at the conservative Republican Study Committee after he was caught sending emails to conservative groups urging them to pressure GOP lawmakers to kill the deficit plan proposed by Speaker John Boehner. The opposition from the right is the latest sign of deep divisions within the Republican party over how to handle the debt crisis.
IP: Logged |
jwhop
Knowflake Posts: 3921
From: Madeira Beach, FL USA
Registered: Apr 2009
|
posted July 27, 2011 03:03 PM
The title of this thread is:"5 Lies Being Told In The National Debt Debate" But, there's another lie,(6), being told and it's the mother of all lies. It's being told by demoscats, republicans and independents. It's being told by every member of the broadcast and print media. It's being told by every pundit and talking head. This is the lie. There are no plans whatsoever to make any cuts to the federal budget. The Cut, Cap and Balance plan passed by House Republicans comes closest to making actual cuts. But not in the "CUT" phase of the plan. There is no plan and no intention of passing any plan whereby next years federal budget will be smaller than this years federal budget. Budgets are normally passed on 10 year future projected spending. Each year is the "baseline" for the next years spending. Each year in the budget shows a projected increase in spending by the federal government over the previous years "baseline". So, when you hear the wailing and gnashing of teeth over "spending cuts" in the budget, it's all utter horseshiiit. They're all liars. The only thing being discussed is a reduction in the projected "increase" in spending. If the "baseline budget" for the current year was $1,000,000 and next years budget was scheduled...due to "baseline budgeting"...to be $110,000,000 and you removed $5,000,000 from the scheduled increase in spending, you spent $5,000,000 MORE than you did in the "baseline year". That's not a "CUT". That's a spending increase. So, the federal budget shows about $10 Trillion in additional spending over the next 10 years. The "Plans" call for a spending cut of $2-3 Trillion over the next 10 years. That's NOT a cut. That's an increase in spending of $7-10 Trillion. It's a damned lie, a hoax and a con job. I'm ready to throw all the lying bast@rds out on their lying as$es...including O'Bomber. We need to ax "Baseline Budgeting". Federal spending will never be cut so long as "Baseling Budgeting" is the rule in Congress and White House. IP: Logged |
Node
Knowflake Posts: 1437
From: 1,981 mi East of Truth or Consequences NM
Registered: Apr 2009
|
posted July 27, 2011 05:09 PM
JW quote:
There are no plans whatsoever to make any cuts to the federal budget
really? who has not put forth a plan to do so?  IP: Logged |
jwhop
Knowflake Posts: 3921
From: Madeira Beach, FL USA
Registered: Apr 2009
|
posted July 28, 2011 09:29 AM
Just to show the extent of the debt problem facing the United States...and taxpayers who will be called upon to pay, and pay, and pay and pay and never be able to pay it off; there's this visual display of US debt.Just the "unfunded liabilities" of the United States are almost twice..2 times the Gross Domestic Product of the entire world. Yet, O'Bomber and his Socialist comrades in Congress adamantly refuse to rein in their out of control spending. Go figure. There is no plan to actually CUT spending. Merely a plan to slow the growth of spending increases. Which is why next years spending budget must be smaller than this years spending budget...CUTS. Why any future spending must be directly tied/CAPPED to the US GDP at about 18% and no more and a Constitutional Amendment be passed that all future US budgets not exceed US tax revenues...BALANCED. Anything else is total fiscal insanity. http://www.wtfnoway.com/
IP: Logged |
katatonic
Knowflake Posts: 6786
From:
Registered: Apr 2009
|
posted July 28, 2011 11:27 AM
U.S. president Party Term years Start debt/GDP End debt/GDP Increase debt ($T) Increase debt/GDP
(in percentage points) House Control
(with # if
split during term) Senate Control
(with # if
split during term)
Roosevelt/Truman D 1945–1949 117.5% 93.1% -0.01 -24.4% 79th D, 80th R 79th D, 80th R
Truman Harry Truman D 1949–1953 93.1% 71.4% 0.01 -21.7% D D
Eisenhower1 Dwight Eisenhower R 1953–1957 71.4% 60.4% 0.01 -11.0% 83rd R, 84th D 83rd R, 84th D
Eisenhower2 Dwight Eisenhower R 1957–1961 60.4% 55.2% 0.02 -5.2% D D
Kennedy/Johnson D 1961–1965 55.2% 46.9% 0.03 -8.3% D D
Johnson Lyndon Johnson D 1965–1969 46.9% 38.6% 0.04 -8.3% D D
Nixon1 Richard Nixon R 1969–1973 38.6% 35.6% 0.10 -3.0% D D
Nixon2 Nixon/Ford R 1973–1977 35.6% 35.8% 0.24 +0.2% D D
Carter Jimmy Carter D 1977–1981 35.8% 32.5% 0.29 -3.3% D D
Reagan1 Ronald Reagan R 1981–1985 32.5% 43.8% 0.82 +11.3% D R
Reagan2 Ronald Reagan R 1985–1989 43.8% 53.1% 1.05 +9.3% D 99th R, 100th D
Bush GHW George H. W. Bush R 1989–1993 53.1% 66.1% 1.48 +13.0% D D
Clinton1 Bill Clinton D 1993–1997 66.1% 65.4% 1.02 -0.7% 103rd D, 104th R 103rd D, 104th R
Clinton2 Bill Clinton D 1997–2001 65.4% 56.4% 0.40 -9.0% R R
Bush GW1 George W. Bush R 2001–2005 56.4% 63.5% 2.14 +7.1% R 107th Split, 108 R
Bush GW2 George W. Bush R 2005–2009 63.5% 84.2% 3.97 +20.7% 109th R, 110th D 109th R, 110th D
Obama1 Barack Obama
D 2009– 84.2% 93.2% (2010) 1.65 (2010) +9.0% (2010) 111th D, 112th R D rats, this was a chart but didn't copy as one, looking for a better visual. in short, though, the debt to GDP ratio has not been as low as 18% in the last 65 years...truman and eisenhower and clinton actually brought the ratio DOWN, everyone else has increased it; and looking at several of these charts i have realized that the longer the term, the better the average, so judging someone on two years' work is not relevant really... IP: Logged |
katatonic
Knowflake Posts: 6786
From:
Registered: Apr 2009
|
posted July 28, 2011 11:43 AM
At the end of World War II, the US debt/GDP ratio was 117%. That is, if our GDP were $100B that year, our total accumulated debt since the revolution was $117B. Of course, we had just before that fought a World War, and suffered the worst Depression in our nation's history. Having emerged from those debacles as the world's strongest economy, and soon to control the world's reserve currency, there was no reason to believe it would not decline.It did. Indeed, that ratio declined every Presidential term thereafter -- under Truman, Eisenhower, Kennedy, Johnson, Nixon, and inched up only 0.2% under Ford, essentially even. It also declined under Jimmy Carter to a low of 32.5%. During this period there were wars, recessions, inflation, stagflation, top tax rates ranging from 90% to 70%, mostly Democratic but occasionally Republican Congresses, major industrial strikes, oil embargoes, a national malaise, clean-air and clean-water acts, the EPA, the Department of Energy, the Department of Education, and even "W-I-N" (whip-inflation-now) buttons, Gerald Ford's lapel-based strategy for combating inflation. Then, the debt/GDP ratio skyrocketed again. Now, who followed Carter ... just cannot seem to recall, can you? Under Ronald Reagan, the debt/GDP ratio ballooned by over 20% to reach levels not seen since Eisenhower. Note that the denominator -- GDP -- grew under Reagan so that must mean ... oh, no, it couldn't ... that the debt grew more rapidly than ever before. Under Reagan. Yes, under the visible hand of "the-government-is-too-big-and-spends-too-much-money ... if-not-us, who-if-not-now,-when" Ronald Wilson Reagan. (Republicans will rush to blame Democrats in Congress for the spending, but two facts render that bogus: i) Democrats had controlled Congress for most of the post-war period when the ratios fell, the only political variable now Reagonomics; and ii) Reagan never even submitted a balanced budget and the Congress appropriated the same in toto as Reagan requested ($7.314T requested; $7.361T appropriated over 8 years). Then H.W. Bush, continuing the new-time economic religion, set new pool, league and American records, growing the ratio 13% in just one term. Fortunately, Bill Clinton was able to reverse much of that, with a nearly 10% reduction in the ratio. [Causing Congressional Republicans to become apoplectic, crying to "get the money out of Washington", not reduce debt/GDP ratio further in case there were a rainy day]. Enter G.W. Bush. Not to be outdone by his father -- his recurring psychodrama visited upon the country -- George W. added 27% in two terms to the debt/GDP ratio. You see, G.W. was going to be like the courageous Ronald Reagan, not his wimpy father -- although, to be sure, his "wimpy" father volunteered for World War II, whereas Ronnie and Georgie headed for the hills during their generation's wars. So, with the magic of George W, we entered the Obama era with an 83% debt/GDP ratio. The highest since Harry Truman who had reduced the ratio to 70%. That's six decades. Just for good measure, W. left us two wars and the early part of the worst recession since the 1930s. Take that, America. Take that, Barack Obama. At least Truman began with a strong economy and just months of remaining war. At least Reagan dug his hole for us 20 years before the baby-boomers were to retire, and signed off on a fix to Social Security that included a payroll tax increase. And, Reagan began the practice of raiding the Social Security trust fund to help pay for deficits. W., on the other hand, worked his wonders just as the boomers were retiring, and did nothing about Social Security except to fight for privatizing it, that would have devastated nearly the entire elderly population had he pulled it off. Perhaps, it might help inform today's policy choices to ask whether there were common themes for our post-World War II periods of profligacy, as defined by debt/GDP ratio growth. Gerrymandering provides Congresses that tend to be more stable than Presidencies that come and go. Moreover, as mentioned above, Congress rarely appropriates more money in toto than a president requests. Hence, perhaps we should focus on the presidents. Remember the words, "tax-cuts pay for themselves"? Soothing. Downright enchanting if repeated enough. And recall their kissing cousins, "tax-cuts [for the wealthy, mostly, but I'll give the rest of you low-lives something as well to make this appear as a principle] stimulate economic growth"? Now, under whose presidencies were those "principles" employed? Reagan. Reagan's VP (H.W. Bush). And, Reagan wannabe (G.W. Bush). In fact, the Reagan wannabe outdid them all. A word about poor H.W. Bush. He had called Reaganomics, "voodoo economics"--an amazing turn of phrase for a nearly inarticulate man, so he must have believed it. But, he was stuck with it. Then, recession struck (his son was to outdo him in magnitude, but that is another story), and HW raised taxes on the wealthy, and Bill Clinton did it again--right in the midst of a recession. And, what happened? Economic growth, budget surpluses, and a 10% reduction in the debt/GDP ratio. Indeed, the two faces of H.W. Bush -- read-my-lipservice to Ronald Reagan, and then following through on his original beliefs so he did part of the heavy-lifting that Clinton had to do, make the point. So, if the country is really looking for a recipe to reverse growth in Debt/GDP ratios -- the fear-mongering du jour of the rightwing -- perhaps, just perhaps, bowing at the altar of St. Ronald is not exactly the economic religion we need. IP: Logged |
katatonic
Knowflake Posts: 6786
From:
Registered: Apr 2009
|
posted July 28, 2011 11:46 AM
so apparently the debt/GDP ratio has NEVER been as low as 18%. i'm wondering what you are "screeching" about jwhop?as in other times when the economy was as stressed as WHEN OBAMA TOOK OFFICE, spending and taxes have brought the debt ratio DOWN and sped our recovery...and it is hard to judge a presidency on 2 years duration compared to others of 4 and 8 years. IP: Logged |
jwhop
Knowflake Posts: 3921
From: Madeira Beach, FL USA
Registered: Apr 2009
|
posted July 28, 2011 11:55 AM
I didn't say anything about debt to GDP ration.I said "SPENDING AS A PERCENT OF GDP" set at 18%. Who in their right mind would think running the federal government should cost even 18% of the total Gross National Product. That's Gross National Product; not Gross National Profit. The US federal government is far too large, far too costly and needs to be put on a strict supervised diet. IP: Logged |
AcousticGod
Knowflake Posts: 5510
From: Pleasanton, CA
Registered: Apr 2009
|
posted July 28, 2011 12:22 PM
It has, but not in over half a century. To reduce it to 18% would mean a dramatic cut to Social Security and Medicare; one even Republicans would have a hard time with.IP: Logged |
katatonic
Knowflake Posts: 6786
From:
Registered: Apr 2009
|
posted July 28, 2011 03:53 PM
fair enough! here is the SPENDING to GDP ratio for all prezzies since reagan. obama's is high, granted...but nearly 1 trillion was signed into law by bush as he ran out the back door...and he has not served a full term yet - which if you look even at reagan's record, makes a big diff over time. in reagan's last year the percentage was a good deal MORE than 18%U.S. GDP vs. U.S. Expenditures Each president has had his own spending style and a different, current GDP amount. Ronald Reagan began his eight-year term in 1981 with a GDP amount of about $3 trillion. During that year, the expenditures were about $1 trillion. Both the GDP and the expenditure number climbed steadily during Reagan’s two terms. The final year of Reagan’s second term, 1988, saw a U.S. GDP of about $5 trillion and expenditures of about $1.75 trillion George H. W. Bush was president during four years of steady GDP and expenditure growth, starting with a GDP of about $5 trillion in 1989. There were about $2 trillion in expenditures in 1989. At the end of his term, in 1992, the U.S. had a GDP of about $6.5 trillion. The U.S. government expenditures in 1992 were $2 trillion. President Bill Clinton came into office with a U.S. GDP of $7 trillion in 1993. The expenditures of the U.S. government in 1993 were about $2 trillion. During Clinton’s eighth year of office, the GDP had greatly grown while the amount of U.S. expenditures rose moderately. The last year that Clinton was in office, 2000, showed the lowest expenditure to GDP ratio. That ratio was 32.6 percent. The GDP in 2000 was about $10 trillion. The U.S. expenditures of 2000 were about $3.2 trillion. George W. Bush took office in 2001, and the GDP of the U.S. was about $10.3 trillion. The U.S. expenditures in 2001 were about $3.3 trillion. For the last year of George W. Bush’s two terms, in 2008, the U.S. GDP was about $14 trillion. The U.S. expenditures in 2008 were about $5 trillion. President Barrack Obama took office in 2009 with the highest expenditure to GDP ratio. The ratio was 44.7 percent. In 2009, the U.S. GDP was about $14 trillion. U.S. expenditures were about $6.2 trillion. In 2010, the GDP is about $14.6 trillion. U.S. expenditures were about $7 trillion. in fact the LOWEST ratio since 81 was in clinton's last year, when it was 32+%, during reagan's term it was more like 40%...and so on. IP: Logged | |
 Lindaland


 UBBFriend: Email This Page to Someone!