|
Author
|
Topic: Global Warming Scam Pays Off For More Researchers
|
Randall
Webmaster Posts: 37528
From: Saturn next to Charmainec
Registered: Apr 2009
|
 posted February 10, 2014 05:47 AM
  
Actually, there are many scientific journal articles that have been published on the other side. You refuse to acknowledge them...or any expert in their scientific field unless they work for the IPCC or NOAA. CO2 actually causes cooling in the stratosphere, which you would know if you actually read what I posted. The main culprit in warming is cloud cover. There is no cause for alarm and never was any for scientists who are credible. If 98 percent of CO2 is naturally occurring, then what difference can man make? Can you yourself do simple math? Surely no rational thinking individual needs a scientist to calculate this on his behalf. IP: Logged |
Randall
Webmaster Posts: 37528
From: Saturn next to Charmainec
Registered: Apr 2009
|
 posted February 10, 2014 06:04 AM
Kirk Myers
Seminole County Environmental News ExaminerIf the man-made-climate-change true-believers are correct, humans thoughtlessly contaminate the earth�s atmosphere each time they exhale. Why? Because with each breath, humans expel a mouthful of carbon dioxide (CO2), the so-called bad-guy atmospheric gas blamed by environmental guru Al Gore and other climate-change Casandras for increasing global temperatures. (For the record, recent global surface temperatures have been going down, even as CO2 levels have gone up.) So far, none of the global warmists who jetted into Copenhagen last week to attend the UN�s IPCC climate-change conclave has gone so far as to suggest that their fellow homo sapiens should breathe more sparingly lest the earth turn into a sauna and the polar caps melt. But for years, government-funded scientists and their legion of �Green� supporters, aided by willing media mouthpieces, have excoriated industrialized countries for polluting the earth�s atmosphere with a noxious blanket of CO2, thereby creating a mercury-rising �greenhouse effect� that, they claim, will unleash a horror of cataclysmic weather events across the globe. But does the oft-maligned CO2 deserve all the criticism? Is it truly the nasty culprit behind impending climate chaos? Or is it merely the fall-guy � a convenient climate-change patsy forced to shoulder the blame, while the sun, cosmic galactic rays, ocean currents, volcanoes and other climate influencers get a free pass? These are not unimportant questions. A growing body of climate experts believes it is disingenuous and, frankly, unscientific to blame CO2 � a minuscule constituent of the planet�s atmosphere � for the small increase in average global surface temperatures, roughly 1.33 degrees, that has occurred during the last century. Here are a few CO2 facts, from Geocraft.com, that have either been swept aside or simply escaped the eyes of mainstream news outlets � those ever-vigilant guardians of the planet � whose job is to inform the public about such weighty matters, but who seem more interested in boosting readership and TV ratings by deluging audiences with a never-ending torrent of climate-change scare stories. Fact 1: At 385 parts per million (ppm), CO2 is a minor constituent of earth's atmosphere � less than 4/100 of 1 percent of all gases present. Compared to earlier geologic times, earth's current atmosphere is CO2-impoverished. Fact 2: CO2 is odorless, colorless, and tasteless. Plants absorb CO2 and emit oxygen as a waste product. Humans and animals breathe oxygen and emit CO2 as a waste product. Fact 3: Carbon dioxide is a nutrient, not a pollutant, and all life � plants and animals alike � benefit from more of it. All life on earth is carbon-based and CO2 is an essential ingredient. When plant-growers want to stimulate plant growth, they introduce more carbon dioxide. Fact 4: CO2 emissions do not stay in the atmosphere. They are continually recycled by terrestrial plant life and earth's oceans � the watery repository for most terrestrial carbon dioxide. Fact 5: Water vapor is by far the most abundant greenhouse gas, accounting for about 95 percent of Earth's greenhouse effect, and man�s contribution to it is insignificant. Anthropogenic (man-made) CO2 contributions are responsible for only about 0.117 percent (see accompanying graph) of Earth's greenhouse effect. Using a real-world comparison, 0.117 percent of a football field would equal just over 4 inches. Fact 6: When other anthropogenic greenhouse gases � methane (CH4), nitrous oxide (N2O), and trace elements such as CFCs � are added to the above CO2 figure (.117 percent), the total human contribution to greenhouse gases is .28 percent. Those numbers are very telling, yet conspicuously absent from the spate of news stories over recent years predicting a climate meltdown. Quite simply, the volume of CO2 produced by humans is tiny compared to the percentage of water vapor, the big kahuna of greenhouse gases. As the Geocraft article mentions: �Human activities contribute slightly to greenhouse gas concentrations through farming, manufacturing, power generation, and transportation. However, these emissions are so dwarfed in comparison to emissions from natural sources we can do nothing about, that even the most costly efforts to limit human emissions would have a very small � perhaps undetectable � effect on global climate.� Even if CO2 levels were to double or triple, no harm would come to the planet. Why? Because, contrary to the nonstop fright-mongering by the IPCC, Green lobby and researchers in search of grant money, CO2 is neither a pollutant nor enemy of mankind. It is one of life�s essential elements. As researcher Sherwood Idso, president of the Tempe, Ariz. Center of Carbon Dioxide and Global Change, has demonstrated, plants thrive in high-CO2 environments (humans, when they exhale, do plants a favor). Atmospheric CO2 enrichment stimulates agriculture by enhancing leaf photosynthesis, resulting in higher crop yields and increased global food production. During the Jurassic period, CO2 levels in the atmosphere were in the neighborhood of 1,950 ppm � five times the concentration of today�s modest 385 ppm. During that period, the earth flourished in the fertile embrace of life-giving CO2. As physical science and mathematics professor Richard F. Yada writes in his 2009 paper, �Reality Check: CO2�: �The great lesson from geologic history is that carbon dioxide is critical to life. The move to label it as a pollutant is simply preposterous. The logical extension to that thought process is that the government has legally regulated life. The notion would be laughable if it were not so tragically real.� Will the greenhouse-effect prognosticators stand down for a moment from their doom-and-gloom forecasts, reappraise their research, and take a second look at CO2 and its impact on global climate, searching only for the truth instead of the next round of government funding? Don�t hold your breath.
http://www.examiner.com/article/man-made-co2-has-minimal-effect -on-climate-change-claim-global-warming-skeptics IP: Logged |
Randall
Webmaster Posts: 37528
From: Saturn next to Charmainec
Registered: Apr 2009
|
posted February 10, 2014 06:09 AM
http://www.geocraft.com/WVFossils/greenhouse_data.html IP: Logged |
Randall
Webmaster Posts: 37528
From: Saturn next to Charmainec
Registered: Apr 2009
|
posted February 10, 2014 06:14 AM
Does CO2 really drive global warming?
I don�t believe that it does.To the contrary, if you apply the IFF test�if-and-only-if or necessary-and-sufficient�the outcome would appear to be exactly the reverse. Rather than the rising levels of carbon dioxide driving up the temperature, the logical conclusion is that it is the rising temperature that is driving up the CO2 level. Of course, this raises a raft of questions, but they are all answerable. What is particularly critical is distinguishing between the observed phenomenon, or the �what�, from the governing mechanism, or the �why�. Confusion between these two would appear to be the source of much of the noise in the global warming debate. In applying the IFF test, we can start with the clear correlation between the global CO2 profile and the corresponding temperature signature. There is now in the literature the report of a 400,000-year sequence clearly showing, as a phenomenon, that they go up�and down�together (1). The correlation is clear and accepted. But the causation, the mechanism, is something else: Which is driving which? Logically, there are four possible explanations, but only two need serious consideration, unless they both fail. Case 1: CO2 drives the temperature, as is currently most frequently asserted; and
Case 2: Temperature drives the level of CO2.
Both appear at first to be possible, but both then generate crucial origin and supplementary questions. For Case 1, the origin question is: What is the independent source of CO2 that drives the CO2 level both up and down, and which in turn, somehow, is presumed to drive the temperature up and down? For Case 2, it is: What drives the temperature, and if this then drives the CO2, where does the CO2 come from? For Case 2, the questions are answerable; but for Case 1, they are not. Consider Case 2. This directly introduces global warming behavior. Is global warming, as a separate and independent phenomenon, in progress? The answer, as I heard it in geology class 50 years ago, was �yes�, and I have seen nothing since then to contradict that position. To the contrary, as further support, there is now documentation (that was only fragmentary 50 years ago) of an 850,000-year global-temperature sequence, showing that the temperature is oscillating with a period of 100,000 years, and with an amplitude that has risen, in that time, from about 5 �F at the start to about 10 �F �today� (meaning the latest 100,000-year period) (2). We are currently in a rise that started 25,000 years ago and, reasonably, can be expected to peak �very shortly�. On the shorter timescales of 1000 years and 100 years, further temperature oscillations can be seen, but of much smaller amplitude, down to 1 and 0.5 �F in those two cases. Nevertheless, the overall trend is clearly up, even through the Little Ice Age (~1350�1900) following the Medieval Warm Period. So the global warming phenomenon is here, with a very long history, and we are in it. But what is the driver? Arctic Ocean model
The postulated driver, or mechanism, developed some 30 years ago to account for the �million-year� temperature oscillations, is best known as the �Arctic Ocean� model (2). According to this model, the temperature variations are driven by an oscillating ice cap in the northern polar regions. The crucial element in the conceptual formulation of this mechanism was the realization that such a massive ice cap could not have developed, and then continued to expand through that development, unless there was a major source of moisture close by to supply, maintain, and extend the cap. The only possible moisture source was then identified as the Arctic Ocean, which, therefore, had to be open�not frozen over�during the development of the ice ages. It then closed again, interrupting the moisture supply by freezing over. So the model we now have is that if the Arctic Ocean is frozen over, as is the case today, the existing ice cap is not being replenished and must shrink, as it is doing today. As it does so, the Earth can absorb more of the Sun�s radiation and therefore will heat up�global warming�as it is doing today, so long as the Arctic Ocean is closed. When it is warm enough for the ocean to open, which oceanographic (and media) reports say is evidently happening right now, then the ice cap can begin to re-form. As it expands, the ice increasingly reflects the incoming (shorter-wave) radiation from the sun, so that the atmosphere cools at first. But then, the expanding ice cap reduces the radiative (longer-wave) loss from the Earth, acting as an insulator, so that the Earth below cools more slowly and can keep the ocean open as the ice cap expands. This generates �out-of-sync� oscillations between atmosphere and Earth. The Arctic Ocean �trip� behavior at the temperature extremes, allowing essentially discontinuous change in direction of the temperature, is identified as a bifurcation system with potential for analysis as such. The suggested trip times for the change are interesting: They were originally estimated at about 500 years, then reduced to 50 years and, most recently, down to 5 years (2). So, if the ocean is opening right now, we could possibly start to see the temperature reversal under way in about 10 years. What we have here is a sufficient mechanistic explanation for the dominant temperature fluctuations and, particularly, for the current global warming rise�without the need for CO2 as a driver. Given that pattern, the observed CO2 variations then follow, as a driven outcome, mainly as the result of change in the dynamic equilibrium between the CO2 concentration in the atmosphere and its solution in the sea. The numbers are instructive. In 1995, the Intergovernmental Panel on Climate Change (IPCC) data on the carbon balance showed ~90 gigatons (Gt) of carbon in annual quasi-equilibrium exchange between sea and atmosphere, and an additional 60-Gt exchange between vegetation and atmosphere, giving a total of ~150 Gt (3). This interpretation of the sea as the major source is also in line with the famous Mauna Loa CO2 profile for the past 40 years, which shows the consistent season-dependent variation of 5�6 ppm, up and down, throughout the year�when the average global rise is only 1 ppm/year. In the literature, this oscillation is attributed to seasonal growing behavior on the �mainland� (4), which is mostly China, >2000 mi away, but no such profile with that amplitude is known to have been reported at any mainland location. Also, the amplitude would have to fall because of turbulent diffusive exchange during transport over the 2000 mi from the mainland to Hawaii, but again there is lack of evidence for such behavior. The fluctuation can, however, be explained simply from study of solution equilibria of CO2 in water as due to emission of CO2 from and return to the sea around Hawaii governed by a �10 �F seasonal variation in the sea temperature. Impact of industrialization
The next matter is the impact of fossil fuel combustion. Returning to the IPCC data and putting a rational variation as noise of ~5 Gt on those numbers, this float is on the order of the additional�almost trivial (<5%)�annual contribution of 5�6 Gt from combustion of fossil fuels. This means that fossil fuel combustion cannot be expected to have any significant influence on the system unless, to introduce the next point of focus, the radiative balance is at some extreme or bifurcation point that can be tripped by �small� concentration changes in the radiation-absorbing�emitting gases in the atmosphere. Can that include CO2? This now starts to address the necessity or �only-if� elements of the problem. The question focuses on whether CO2 in the atmosphere can be a dominant, or �only-if� radiative-balance gas, and the answer to that is rather clearly �no�. The detailed support for that statement takes the argument into some largely esoteric areas of radiative behavior, including the analytical solution of the Schuster�Schwarzschild Integral Equation of Transfer that governs radiative exchange (5�7), but the outcome is clear. The central point is that the major absorbing gas in the atmosphere is water, not CO2, and although CO2 is the only other significant atmospheric absorbing gas, it is still only a minor contributor because of its relatively low concentration. The radiative absorption �cross sections� for water and CO2 are so similar that their relative influence depends primarily on their relative concentrations. Indeed, although water actually absorbs more strongly, for many engineering calculations the concentrations of the two gases are added, and the mixture is treated as a single gas. In the atmosphere, the molar concentration of CO2 is in the range of 350�400 ppm. Water, on the other hand, has a very large variation but, using the �60/60� (60% relative humidity [RH] at 60 �F) value as an average, then from the American Society of Heating, Refrigerating and Air-Conditioning Engineers standard psychrometric chart, the weight ratio of water to (dry) air is ~0.0065, or roughly 10,500 ppm. Compared with CO2, this puts water, on average, at 25�30 times the (molar) concentration of the CO2, but it can range from a 1:1 ratio to >100:1. Even closer focus on water is given by solution of the Schuster�Schwarzschild equation applied to the U.S. Standard Atmosphere profiles for the variation of temperature, pressure, and air density with elevation (8). The results show that the average absorption coefficient obtained for the atmosphere closely corresponds to that for the 5.6�7.6-�m water radiation band, when water is in the concentration range 60�80% RH�on target for atmospheric conditions. The absorption coefficient is 1�2 orders of magnitude higher than the coefficient values for the CO2 bands at a concentration of 400 ppm. This would seem to eliminate CO2 and thus provide closure to that argument. This overall position can be summarized by saying that water accounts, on average, for >95% of the radiative absorption. And, because of the variation in the absorption due to water variation, anything future increases in CO2 might do, water will already have done. The common objection to this argument is that the wide fluctuations in water concentration make an averaging (for some reason) impermissible. Yet such averaging is applied without objection to global temperatures, when the actual temperature variation across the Earth from poles to equator is roughly �100 to +100 �F, and a change on the average of �1 �F is considered major and significant. If this averaging procedure can be applied to the atmospheric temperature, it can be applied to the atmospheric water content; and if it is denied for water, it must, likewise, be denied for temperature�in that case we don�t have an identified problem! What the evidence shows
So what we have on the best current evidence is that global temperatures are currently rising;
the rise is part of a nearly million-year oscillation with the current rise beginning some 25,000 years ago;
the �trip� or bifurcation behavior at the temperature extremes is attributable to the �opening� and �closing� of the Arctic Ocean;
there is no need to invoke CO2 as the source of the current temperature rise;
the dominant source and sink for CO2 are the oceans, accounting for about two-thirds of the exchange, with vegetation as the major secondary source and sink;
if CO2 were the temperature�oscillation source, no mechanism�other than the separately driven temperature (which would then be a circular argument)�has been proposed to account independently for the CO2 rise and fall over a 400,000-year period;
the CO2 contribution to the atmosphere from combustion is within the statistical noise of the major sea and vegetation exchanges, so a priori, it cannot be expected to be statistically significant;
water�as a gas, not a condensate or cloud�is the major radiative absorbing�emitting gas (averaging 95%) in the atmosphere, and not CO2;
determination of the radiation absorption coefficients identifies water as the primary absorber in the 5.6�7.6-�m water band in the 60�80% RH range; and
the absorption coefficients for the CO2 bands at a concentration of 400 ppm are 1 to 2 orders of magnitude too small to be significant even if the CO2 concentrations were doubled.
The outcome is that the conclusions of advocates of the CO2-driver theory are evidently back to front: It�s the temperature that is driving the CO2. If there are flaws in these propositions, I�m listening; but if there are objections, let�s have them with the numbers. References Sigman, M.; Boyle, E. A. Nature 2000, 407, 859�869.
Calder, N. The Weather Machine; Viking Press: New York, 1974.
Intergovernmental Panel on Climate Change. Climate Change 1995: The Science of Climate Change; Houghton, J. T., Meira Filho, L. G., Callender, B. A., Harris, N., Kattenberg, A., Maskell, K., Eds.; Cam bridge University Press: Cambridge, U.K., 1996.
Hileman, B. Chem. Eng. News 1992, 70 (17), 7�19.
Schuster, A. Astrophysics J. 1905, 21, 1�22.
Schwarzschild, K. Gesell. Wiss. Gottingen; Nachr. Math.�Phys. Klasse 1906, 41.
Schwarzschild, K. Berliner Ber. Math. Phys. Klasse 1914, 1183.
Essenhigh, R. H. On Radiative Transfer in Solids. American Institute of Aeronautics and Astronautics Thermophysics Specialist Conference, New Orleans, April 17�20, 1967; Paper 67-287; American Institute of Aeronautics and Astronautics: Reston, VA, 1967. Robert H. Essenhigh is the E. G. Bailey Professor of Energy Conversion in the Department of Mechanical Engineering, Ohio State University, 206 W. 18th Ave., Columbus, OH 43210; 614-292-0403; essenhigh.1@osu.edu.
http://pubs.acs.org/subscribe/journals/ci/31/special/may01_viewpoint.html IP: Logged |
Randall
Webmaster Posts: 37528
From: Saturn next to Charmainec
Registered: Apr 2009
|
posted February 10, 2014 06:18 AM
Straight from a climatologist:
http://pubs.acs.org/subscribe/journals/ci/31/special/may01_viewpoint.html IP: Logged |
Randall
Webmaster Posts: 37528
From: Saturn next to Charmainec
Registered: Apr 2009
|
posted February 10, 2014 06:36 AM
According to RADICAL environmentalists world-wide, the CO2 produced by the use of fossil fuels is producing enough carbon dioxide "emissions" to create a shift in the global climate, significant enough to cause problems with the environment, melting of the polar ice caps, and eventually, our extinction.But their so-called "research" is based on flawed logic. Not only does it assume that MAN MADE CO2 is "the problem" it also assumes that CO2 is the ONLY so-called "greenhouse gas" on the planet, AND that man-made CO2 is the primary driving force for "global climate change". Of course, anyone with basic high school chemistry and general science knowledge should be able to see that this is completely ridiculous. Still, for the sake of argument, I'll begin by demonstrating that CO2 levels are NOT causing global warming because of any specific human activity (particularly the kind of activity that burns fossil fuels). Then I shall demonstrate that CO2 is NOT the primary 'greenhouse gas', thus demonstrating that focusing on CO2 is really, really narrow-minded (if not just simply 'clueless'). And finally I'll demonstrate a possible model for showing how and why solar cycles happen, and why we are currently in a 'maximum output' period. And if that's not enough for you, I've even proposed a possible motivation for the "Global Climate Change" hoax, and who it is that would benefit from the use 'Global Warming' for political and/or economic purposes. THE CO2 SECTION First, I'll bore you with some simple calculations, which you can repeat yourself. Feel free to report any errors to me so that I can correct them. HUMAN BEINGS EXHALE CO2 (duh!) I once did an experiment in which I held my breath for approximately 1 minute, and using an exhaust gas analyzer, I measured the percent O2 in my exhaled breath. I discovered that after holding my breath for a minute, the percent oxygen was approximately 10%, less than half of normal (20.9%). I did this to see how efficient my lungs were at extracting oxygen from the air. I found that I could get it as low as 5% if I held my breath long enough, but below that I had some trouble holding my breath. Because I was "at rest" when I did this, it is a good representation of the amount of oxygen that I consume on average, while "at rest". For sake of calculations, we must assume that every molecule of Oxygen inhaled and metabolized by your body produces one molecule of CO2. By mass ratio, this is 44 grams CO2 per 32 grams O2. Volumetrically, this is 44 grams for every 22.4 liters (1 mole gas at STP) of pure oxygen. With the assumption that an AVERAGE lung capacity is approximately 1 liter (my lung capacity is approximately 2 liters, measured while I was in the Navy, in a preliminary examination I took for working with asbestos), and if we assume that an average person could hold his/her breath for 1 minute and utilize 50% of the O2 in that breath, at rest, such that it represents the normal average oxygen consumption by that individual, we can calculate the total CO2 production as follows:
1 liter air
* (1440 minutes/day)
* (1/22.4 liters/mole)
* (0.209 moles O2/mole air)
* 1/2 (50% utilization)
* 1 mole CO2 per mole O2
* 44 grams / mole CO2
= ~300 grams CO2 per person per day At 2.2 lbs per KG, that's equal to 0.66 lbs per day. NOW, using this information, and extrapolating out the entire population of the world, roughly 5 billion people, we have approximately 3.3 billion lbs of CO2 generated per day by people exhaling, or 3.3 billion lbs per day of CO2. CARS also 'exhale' CO2 (duh!) OK, so I admit that my car DOES put out CO2, but it's a LOT better than CO or HC emissions. So what are the wacky environmentalist extremists whining about NOW? Well it seems that THEY think that my car is putting out too MUCH of the same gas that every human on the planet is exhaling right now. So let's see JUST how much CO2 I "pollute" the environment with. With the assumption that 1 gallon of gasoline (roughly 6 lbs) burns completely, and thereby produces approximately 1 molecule CO2 for every atom of carbon, AND assuming that gasoline is a PURE hydrocarbon compound, with very few double bonds between carbon atoms, the mass of gasoline will be approximately 14 grams for every 12 grams of carbon. Ideal gasoline for '100 octane' measurements is 1,1, dimethyl-hexane, which has 8 carbons, and 18 hydrogens, which is very very close to this ratio. Adding oxygenate may alter this slightly, but in a direction that REDUCES the result of the calculation. SO, for 1 gallon of gasoline:
1 gallon gasoline
* ~6 lbs per gallon
* 12 g Carbon / 14 g gasoline (grams cancel out)
* 44 g CO2 / 12 g Carbon (grams cancel out again)
= ~19 lbs CO2 per gallon of gasoline.
OK, this is a reasonable figure. From this we can extrapolate that, if every vehicle in the world (estimate 500 million, 1 per 10 people on the planet) were to consume an average of 1 gallon of gasoline per DAY, [an obvious OVER-estimate, even for the U.S.A. because it results in 10,000 miles per year with an overall average of 27MPG per car] then the total production of CO2 would be:
500 million * 19 lbs = 9.5 billion lbs CO2 per day.
For the sake of comparison, this is approximately 3 times the amount breathed by humans AT REST. Assuming that all of these cars are being driven this much, the amount of CO2 "exhaled" by cars is three times that of all of the humans on the planet. THE UNITED STATES ENVIRONMENTAL PROTECTION AGENCY OK, let's assume that this IS important. What does the U.S. EPA say about it? Well, for starters, you can see for yourself at the following web site:
http://www.epa.gov/otaq/climate/ghgreport/hwy_veh.pdf
According to this document, automobiles in the United States are producing 1,455 Tg of alleged "greenhouse gasses" per year.
The number stated in Table 2-1 is 1,371.2 Tg (tera-grams, or 10^12 grams), equivalent to
1.37 x 10^12 KG CO2 per year
- or -
3 x 10^12 lbs of CO2 per year (do the math if you don't believe me)
based on calculations for the year 2000. Per day, this would be ~8 x 10^9 (8 billion) lbs of CO2 from cars in the United States alone. Based upon THIS figure, how many gallons is that? With 19 lbs of CO2 per gallon, you can easily calculate that to be 420 million gallons per DAY. That's 420 million. >1 gallon of gasoline per day for every person in the United States. Now, that assumes that people of "driving age" that aren't retired, or disabled [roughly half the population], are driving an AVERAGE of 20,000 miles per year, each. EACH! For a 5 day work week, this would be an average commute of between 70 and 75 miles (round trip - 35 miles each way, probably over an hours' driving in traffic each way) for every 'working person', plus additional miles for trips to the store, trips to the soccer field, and so on. And most of the cars people commute in have reasonable 'traffic mileage', with very few S.U.V.'s and trucks, because at $1.50+ per gallon, people just can't afford to pay >$50 per week for gasoline for each car that is used for commuting.
And, using these figures, for a 5 year period, the "life" of a car of 100,000 miles would quickly be exceeded, and that would scare the financial companies something fierce. At best, I would think it would be less than HALF of that. Needless to say it seems to me that an exaggeration of facts has taken place by the EPA, and I'd like to see where they get THEIR numbers from. EQUILIBRIUM vs UNSTABLE It is a KNOWN FACT that CO2 is 'entrained' by rain (making it slightly acidic) out of the atmosphere, and that it is depleted into the oceans, and that a large amount of it forms carbonate sediment, and that this carbonate sediment is also "recycled" back into the ocean by volcanic activity at a rate equal to that of the depletion of CO2 by sedimentation, and is both depleted by algae and water plants, and released into the atmosphere from the oceans. The concentration of CO2 in the ocean, and the concentration of CO2 in the atmosphere are at equilibrium, as are the concentration of CO2 in rain and the concentration of CO2 in the atmosphere, such that
If the concentration of atmospheric CO2 increases, rain will deplete it;
- and -
If the concentration of oceanic CO2 increases, sedimentation and algea will deplete it.
Being at equilibrium, a change in one side of the 'balance' causes a shift in the other side of the 'balance', thus maintaining a relatively constant atmospheric concentration over time.
But chemical equilibrium isn't the ONLY thing keeping the CO2 levels stable. There is also BIOLOGICAL EQUILIBRIUM. Plants will grow FASTER if you increase the CO2 concentration, and proportionally will DEPLETE THE CO2 FASTER whenever there is MORE OF IT in the atmosphere. If you don't believe me, you might want to read about that sort of thing HERE. Suffice it to say that every farmer on the planet should be VERY happy if the CO2 concentrations are being increased. BUT, as we know, the wacky environmentalist extremists would have us think that even a SMALL change in the amount of CO2 produced by car exhausts (and power plants and anything else that uses fossil fuel) would have a LARGE change on atmospheric concentrations, and would continue to RISE INDEFINITELY without the depletion rate being affected by the higher CO2 concentration, and thus it would take "hundreds of years" to get back to 'normal levels'. SOME warmists think it will take even longer! But the truth is more reasonable. Volcanic activity (which does increase CO2 levels) has a FAR greater effect than all of the cars and power plants combined, because volcanic activity recycles the sedimentary carbonates back into the ocean, and the warmer water in the vicinity of the volcano causes it to 'give up' some of the precipitate CO2 as 'effervescence'. It's a bit like when a soda goes flat as it gets warm. But were it NOT for the volcanic activity under the oceans, the CO2 levels would be LOWER THAN THEY ARE NOW, due to the CONSTANT formation of carbonate as precipitates, and there wouldn't be NEARLY enough CO2 for all of the plants. We should all be VERY happy that the underwater volcanos are making enough CO2, or we'd all starve to death. Basic chemistry shows that the Hydrogen Carbonate and Carbonate ions (formed by CO2 reacting with water) are both relatively insoluble with MOST metal ions, except for Group I metals. Solubility forms an equilibrium in which SOME of the ion concentration (below the equilibrium constant) will remain in the solution. For more information on carbonates, you can go HERE, but be careful to avoid any 'warmist propoganda' it might lead you to. So what exactly WOULD happen if underwater volcanos stopped erupting? A decrease in underwater volcanic activity would cause more carbonate residue to form on the ocean floor. As rain hydrolizes carbon dioxide from the atmosphere, it deposits it into bodies of water (like the ocean). Carbonate precipitate then forms, causing the concentration of oceanic carbon dioxide to drop. Since the amount of dissolved gas that can be at equilibrium with the ocean is a constant based on temperature, less carbon dioxide is released back into the atmosphere (as part of that equilibrium), and so the carbon dioxide becomes 'trapped' in the ocean as carbonates. Underwater volcanos, however, would stir up (and warm) this precipitate, and cause ADDITIONAL carbon dioxide to be released into the atmosphere. A reduction in the volcanic activity would therefore REDUCE the carbon dioxide naturally released back into the atmosphere from the ocean (at equilibrium).
Then, as the atmospheric carbon dioxide levels drop, less carbon dioxide is depleted by the rain.
As the rain dumps less carbon dioxide into the ocean, oceanic carbon dioxide levels drop, causing less precipitation of carbonate residue, and a new (lower) equilibrium concentration of dissolved carbon dioxide is established in sea water.
As a result of the lower carbon dioxide levels, algea growth diminishes somewhat, producing less oxygen.
Similarly, plant growth on the earth's surface would be reduced slightly, also producing less oxygen.
A shift in worldwide oxygen production would cause an effective increase in carbon dioxide levels in the ocean from animal respiration, and to some extent, in the atmosphere. You can add man-made sources to the production if you like. The fact remains that depletion rate is now lower due to the lower concentration of carbon dioxide.
Eventually, a new equilibrium level is reached where carbon dioxide levels in the atmosphere may be immeasureably lower than they were before, but not significant enough to cause global warming/cooling. Carbon dioxide levels in the ocean would be measurably lower, but total dissolved gas concentration would remain roughly the same.
Oceanic animals breathing the slightly higher concentrations of oxygen may actually flourish a bit more than usual, which would actually cause an increase in the production of CO2. A new "biological equilibrium" would be reached in the oceans. And despite what anybody wants to admit in the wacky environmentalist camp, the same kind of analysis applies when CO2 levels are INCREASED due to car exhaust and power plants and human activity in general, or horse and composting activity (if we abandon cars and go 'natural' in our farming), or there is an increase in the population of all of the animals on the planet for that matter. Whatever the cause, an increase in production rate of carbon dioxide WILL result in all major depletion factors SHIFTING IN THE DIRECTION of DEPLETING THE CARBON DIOXIDE FASTER, no matter HOW MUCH the warmists claim otherwise. Of course, if our world's carbon dioxide cycle were UNSTABLE, and not at equilibrium, even a slight change (such as an increase over time of the population of humans and animals, or a gigantic forest fire) would have had a DRASTIC effect on our global climate, forcing us to radically bounce from ice age to searing heat and drought, flooding of the coastal lands by repeated cycles of melted polar caps, and all of the other disastrous climactic images you can think of. But we know that the earth's climate has been "at equilibrium" since the previous ice age, which was probably caused by an asteroid or comet hitting the earth. It's something we can NOW prevent ourselves, given enough warning. Links As I find more interesting web sites I'll add them here.
Global Warming - The Great Delusion
ClimateGate 2.0 'first look' by The Register
Junk Science dot Com, one of the top 10 most dangerous anti-man-made-warming groups out there
In case you were wondering, THE WARMISTS "NEVER" FALSIFY THEIR DATA. Yeah, no sarcasm here, right?
In particular, note THIS chart from the article (original link here)
similar info and chart here and here
Climate Gate dot Com, which has 500+ articles on the subject. Mirror it soon, before it disappears
U.C. professor resigns from American Physical Society
Calls 'global warming' "the greatest and most successful pseudoscientific fraud I have seen"
Australian Climate Madness, a refreshing perspective from 'Down Under'
Not Evil, Just Wrong promoting their movie and other info
As for my opinion, I think the 'Global Warming' crowd is BOTH evil AND wrong. But that's me.
Powerful Documentary Trounces Man-Made Warming Hoax
Global warming brings peace and happiness
Dr. Timothy Ball, 'Global Warming: The Cold Hard Facts?'
The Crash of the Climate Exchange(not a total win - YET)
NASA confirms CO2 biological equilibrium just like I illustrated above, YEARS AGO!
On, and they also said that doubling CO2 would only cause a SMALL change in temperature. Definitely NOT a global disaster!
Ray Stevens music video about Global Warming (hilarious!)
Norwegian Study shows that doubling CO2 would ONLY INCREASE TEMPERATURES by about 2 degrees C
2012 Temperatures are NOT INCREASING! In fact, they're starting to go DOWN.
Good thing that CO2 levels are INCREASING in spite of all of the hype, because THAT way the 'warmists' can't take credit when temps drop significantly, like maybe in 2013?
The effect of CO2 concentration on plant growth from the Ontario Ministry of Agriculture
Feedback Someone honestly wrote an e-mail to me, and I believe it epitomizes what most people on the 'global warming' side of the argument believe. Rather than criticize it point by point (I don't really need to make people into targets like that), I'll simply quote it 'as-is' and summarize my response. Your argument regarding global warming is somewhat flawed.
While humans do exhale allot (sic) of CO2, all of that CO2 comes from the carbon
in simple sugars and carbohydrates in the food we eat. All the of the food we eat
comes from either plants, or animals that eat plants (or animals that eat
animals that eat plats etc...). Plants make their carbon products (sugars,
carbohydrates etc...) from C02 in the atmosphere. Thus, all of the CO2 we
exhale originally came from plants and all of that carbon originally came
from the atmosphere itself. Therefore it is impossible for us to
contribute to the over all CO2 accumulation in the atmosphere because all
of the CO2 we breath back into the atmosphere was originally take out by
plants. Because of this the net increase of CO2 contributed by humans
always comes out to zero. It is possible however for gasoline, coal and
oil to contribute to CO2 accumulation. All of the carbon that is released
when they burn also originally came from plants however it has accumulated
over millions of years as opposed to the sort time in which it takes to
grow our food. Oil and coal are made of organic matter (plants from
millions of years ago. There is allot of carbon trapped in this from as it
has had a very, very long time to accumulate. When we burn oil and coal we
release this trapped carbon in the form of CO2. Because oil is formed at
such a slow rate and we are burning it at such a fast rate in comparison,
there is a net increase of carbon going into the atmosphere. Thus while we
cannot contribute to CO2 accumulation by exhaling CO2 (because it is the
same amount of CO2 that is being taken up by plants that are currently
alive) we can contribute CO2 to the atmosphere by releasing it from stored
forms such as oil and coal because that amount of CO2 will not be taken
up. In short, all of the CO2 that we breath out will become plants again
within our lifetime, but none of the CO2 released by burning oil, coal and
gasoline will become oil coal and gasoline within our lifetime. Please
look into all of this yourself, I'm not trying to deceive you.
Misinformation can be very dangerous, as it leads people to ignore
problems that are very real. I hope this is enough to change your mind
about atmospheric CO2 contribution by humans and at least modify your page
in that regard.
Basically, it condescendingly follows the oversimplified assumption that the depletion rate of CO2 remains constant, regardless of changes in the production rate. Yet it can easily be demonstrated that very SMALL concentration changes of CO2 in the atmosphere will cause a significantly HIGHER amount of CO2 to be depleted by rain, due to the equilibrium constant for CO2 forming carbonic acid in rainwater. A small change in either side of the equation (depletion rate or production rate) results in a shift towards the equilibrium concentration of CO2. Following this, CO2 is then depleted within the ocean by precipitation of carbonates. Also keep in mind that MOST of the world's CO2 already exists in the ocean, AND if there were no undersea volcanos, nearly ALL of the world's CO2 would be trapped there. Instead, undersea volcanos stir up the carbonates, and effervesce the CO2 back into the atmosphere. So a much larger factor on CO2 concentration in the atmosphere (as well as any 'global warming' effects it might cause) would be the presence (or absence) of undersea volcanos. The different in magnitude of scale should have people more concerned about volcanos, rather than the burning of fossil fuels. And there has been a little more volcanic activity recently, off the coast of California. Thinking of VOLCANIC ACTIVITY, check out the activity on Antarctica! When warmists claim that ice sheets are SLIDING INTO THE OCEAN because of CO2 warming the planet, consider what the VOLCANOS might be causing, and THAT INCLUDES WARMER CLIMATES AROUND THE ANTARCTIC CONTINENT! Remember, a SINGLE VOLCANO can do FAR MORE than ANYTHING that humans are capable of doing when it comes to warming, greenhouse gasses, and overall destruction. Anyone familiar with Mt. Pinatubo or Mt. St. Helens or (gasp) Mt. VESUVIUS (as in the destruction of Pompeii way back in history) should realize this, without any possible argument whatsoever.
Water - the 'OTHER' Greenhouse Gas
As it turns out, CO2 (which has a very SMALL concentration in the earth's atmosphere) is NOT the 'biggest greenhouse gas on the planet'. Strangely coincidental with what I believe is the agenda of the 'global warming' crowd (to restrict the use of energy by the common folk and reserve it only for the elite) the minor effect of CO2 has the hyperfocus microscope trained upon it, while simultaneously ignoring the 'elephant sized' contributor known as WATER, something that human beings aren't affecting in the least.
Any grade-school aged child above the age of 9 understands the basic hydrological cycle that takes place on our planet, and has been taking place for a few million years (since the 'big cool down'). But as Jeff Foxworthy has pointed out from time to time, the average adult is probably dumber than the smartest 10 year old when it comes to science (and just about everything else). Do I really need to explain to everyone how water evaporates, forms clouds, and rains back to earth? Well, I did make reference to it earlier, as the major depletion factor for atmospheric CO2. I had hoped that everyone would understand this kind of common sense. So here we are talking about water in the atmosphere, something that we ALL know is there, especially on hot sticky summer days in the S.E. United States and various tropical regions throughout the world. Water absorbs FAR MORE EM RADIATION than does CO2, and the following chart (I believe) demonstrates this more accurately than I could otherwise describe: NOTE: Original link broken. A non-broken link to a more complete chart can be found HERE
What is clearly obvious to me (and hopefully to you as well) is that CO2 doesn't absorb NEARLY as much of the IR spectrum, nor the UV spectrum, as does water. What is even MORE important is that water absorbs much LOWER IR FREQUENCIES than does CO2, which means that lower earth temperatures, radiating lower IR frequencies out into space, will get a 'greenhouse effect' from the presence of WATER in the atmosphere, but NOTHING from CO2. So it should be pretty obvious that the effect of changes in concentration of CO2 in the atmosphere is dwarfed by comparison to the effect of changes in concentration of water in the atmosphere, and we ALL KNOW that water concentration changes from day to day, hour to hour, in amounts FAR GREATER than that of CO2, and the planet has NOT gone into a spiraling global warming or global cooling situation as a direct result of it!!!
Now I know that someone's going to point out that there is 'complete absorption' of all infrared radiation by CO2 above 13 microns, and I do not disagree with this at all. But you should keep in mind that 13 microns corresponds with a temperature that's LOWER than anything found on Earth, with the exception of Chicago or Alaska or Antarctica at certain times during the winter. The formula of the PEAK IR wavelength (in microns) to temperature (in degrees K) is about 2900 / wavelength. For 13 microns, this would be about 223 deg K or -50 deg C, or -58 deg F. So next time the temperature gets down THAT far, maybe in Alaska or Chicago or Antarctica, you can thank all of that CO2 that it doesn't get any freaking COLDER. But keeping all of the heat in is OBVIOUSLY the job of WATER and OXYGEN, which traps all of the higher energy photons, and not just the wimpy ones that are trapped by CO2. Like I said, CO2 does absorb IR. It's just that H2O absorbs WAY MORE, and is FAR MORE SIGNIFICANT than CO2. And I would call THAT "the smoking gun" as far as the debate goes. Oh, yeah, it's worth pointing out that the above chart wasn't the ONLY reference I found on this subject. It was merely the one that best illustrated my point. One nice explanation of CO2 absorption lines can be found HERE. On the right you can see a closeup of the CO2 and H2O portions of the above chart. Zooming in you'll notice that CO2's peak is just BELOW -48 C, which is (again) -58 F. The '10 micron' line corresponds to 17 C, or about 63 F. What can clearly be seen here is the amount of IR energy that is absorbed by water at temperatures above freezing (I would expect water vapor concentrations to be VERY LOW below freezing) with a small 'peak' right around the freezing point. Considering that there is typically several HUNDRED times as much water in the atmosphere as there is CO2, it becomes pretty obvious that the absorption of IR energy by CO2 is INSIGNIFICANT when compared to the absorption of IR energy by WATER with IR energy corresponding to temperatures that are WITHIN THE TYPICAL TEMPERATURE RANGE OF THE PLANET. Now, you might argue that IR emissions include a wide spectrum of energies, and you would be right. But when you look at how much the temperature will change when IR of a particular energy is absorbed, it's pretty obvious that HIGHER ENERGIES (shorter wavelengths) matter MORE than LOWER ENERGIES (longer wavelengths). And, the energy per photon is ALSO higher for shorter wavelengths. The probability that a photon will be absorbed is a function of its energy and the 'macroscopic cross section for absorption' of the material. That last nine-dollar phrase is a function of the 'microscopic cross section' (a known factor) and the concentration times the physical distance through which the photon must pass. Think of it as a marble going through a circle with either LOTS of marbles in it (high probability of interaction) or only 1 marble in it (low probability of interaction). So from these charts, the RELATIVE ABSORPTION of a particular energy of photon will not only depend on its energy (for that specific gas) but ALSO ITS CONCENTRATION WITHIN THE ATMOSPHERE. Extending this, consider that water can be up to 2 percent of the atmosphere, particularly in hot, humid areas. CO2, however, is typically only 0.04% of the atmosphere. If the average amount of water in the atmosphere were only 0.4% (relatively dry throughout the world, if you compare it against THIS chart), it's still 10 times the concentration of CO2, and can be as much as 50 times the concentration of CO2. THEN, compare the total amount of RELEVANT IR ENERGY that water absorbs as compared to CO2, and it's pretty obvious which one is the "better" greenhouse gas. And, consider that cloud cover during the day can drop temperature by 10's of degrees F, and cloud cover at night can RAISE it by a similarly high amount (though not QUITE as much as the daytime effect). It's OBVIOUS that WATER makes a HUGE DIFFERENCE on the climate. And it's OBVIOUS that the MINUTE levels of CO2 being put into the atmosphere by human activity, by comparison, is NOTHING. NOTHING. It's like, drop in a bucket, which is (basically) NOTHING AT ALL. ZERO, ZIP, NADA. UNMEASURABLE. NO EFFECT. A fly on the scale when you weigh yourself. NO difference. I have seen at least ONE source attempt to discredit the idea that water vapor has many times the effect of CO2 on global climate. They allude that some kind of 'cycle' exists that somehow amplifies changes in CO2 using water. They are so full of themselves that it is pathetic. Water ABSORBS CO2 FROM THE ATMOSPHERE. This is a well-known chemical reaction. Have you ever heard of ACID RAIN? Do you know where it comes from? That's right, GASES in the atmosphere, like CO2, NO2, NO3, SO2, SO3, etc. are absorbed by the rain, and are DEPLETED FROM THE ATMOSPHERE. We know what the equilibrium constants are for water and for CO2. Spraying water into pure CO2 will CREATE A VACUUM as the CO2 is absorbed. If the pool of water that the spray falls into contains Mg or Ca, the CO2 will PRECIPITATE OUT as MgCO3 and CaCO3, otherwise known as "scale". You can see it on your shower head and bathroom faucets and inside of an old water heater. It is also how shellfish create their shells. Yeah, they bubble CO2 through the water and the hard part of the shell forms. Amazing, isn't it? I learned this when I was in 2nd grade, when we all used straws to blow air through sea water in a glass. You can try THAT experiment, too. So anyone who TRIES to say that the CO2 will 'stay in the atmosphere for hundreds of years' and 'only geological stuff will remove it' needs to get a freaking clue. CO2 is AT EQUILIBRIUM. It is EASY TO DEMONSTRATE with SIMPLE EXPERIMENTS. ADDING TONS OF MORE CO2 to the atmosphere will SIMPLY PRECIPITATE IT ALL OUT IN THE OCEAN. 'Nuff said.
Planetary Cycles vs Solar Activity
One area of science that's clearly being ignored by the vast majority of those involved in the debate of whether or not 'Global Warming' is just a natural cycle is ASTRONOMY. But why Astronomy, you ask? It's because of the tidal forces on the sun as caused by the planets and their combined effect on solar output.
Recently scientists have ADMITTED that, although sunpsot actiivity has been low, SOLAR OUTPUT in the frequency ranges that matter (i.e. visible light and near infrared) have actually INCREASED, which have then significanlty 'warmed' our earth at a rate above normal. An article at The Register goes into more detail, but instead ADMITS that Mr. Sun may be the cause of the warming trend, and NOT man-made carbon dioxide (as was previously assumed). It also demonstrates how very little many scientists really know about how the sun works. Let us not forget that Mr. Sun is also a bozillian times more powerful than we humans are. I'd put Mr. Sun in the 900 billion pound gorilla category any day, as compared to anything HUMANS could accomplish. So when Mr. Sun gets hot under the collar, so do we. No questions there, except maybe WHY this happens. And I think I have a pretty good idea what might be the cause. Astronomers have recently discovered a large number of planets orbiting stars because of the doppler effects on light emitted by a star due to the presence of planets. Some planets were discovered by shadowing effects, so doppler isn't the only method used. Still, it IS significant because it proves a point: a planet, even though it is 'far away' from a star, still has an effect on that star. Our solar system has two very large planets, and about every 60 years they'll share the same orbital angle to the sun. It is my presumption that the combined gravitational effects of Jupiter and Saturn cause a significant tidal force on the sun, and this results in a period of time in which solar activity at certain relative orbital angles from Jupiter and Saturn will be higher than normal. This can either cause warmer or cooler weather, depending upon the earth's relative orbital position and season.
Tidal effects on earth have been known for millenia, and are easily predicted by the sun's and moon's relative position to the earth. When the sun and moon conjoin or oppose, gravitational effects cause much greater tidal bulges than when they are at 90 degrees to one another, relative to the earth. These are referred to as 'Spring Tides' and 'Neap Tides', respectively. Similarly, the combined gravitational force of Jupiter, Saturn, and possibly other planets (Venus, Mars, and Mercury, specifically) will cause 'tidal bulges' to appear on the sun. The next question is obvious: Do the tidal bulges on the sun affect solar output? I say YES! The probability of a nuclear reaction taking place is the result of several physics parameters, which include the materials involved, their energy level (or 'excitation state'), and the DENSITY of the reactants. In the case of nuclear fission we know that a higher density of fissionable material results in a higher 'reactivity' which allows reactors to be physically smaller and still generate power. In the case of hydrogen fusion (the sun's nuclear reaction) we know that high temperature and pressure are necessary to sustain the reaction. We also know that the sun's internal reactor stabilizes itself between gravity and the outward expansion caused by the fusion reaction in the sun's core. As gravity presses reactants together, reaction rate increases, causing the sun to expand, which lowers the reaction rate. This creates the nice stable nuclear fusion reaction that keeps the sun 'burning' and not exploding. We also know that there are natural variations in the reaction rate, variations which follow measurable periods in time. Not so amazingly, the sunspot cycle is also an indicator of solar output and follows (interestingly enough) an 11 year period, which is close to the orbital period of Jupiter (11.87 years). However, Jupiter alone is probably not the culprit here; it's most likely a combination of planets that is the key to the sunspot cycle. And since inner planets move FASTER, the time between 'relative positions' lining up is going to be slightly less than 11.87 years. In fact, Jupiter and Mars will line up about every 2 years, and Earth and Jupiter about once a year, and both Venus and Mercury more often still. My proposal is that certain positions of Jupiter's orbit, particularly its apogee and perigee, along with the positions of other planets, may have a direct effect on solar output, as evidenced by sunspot cycles. Should this, in fact, be the case, you should see a LOT of evidence that compares solar cycles with planetary positions, especially the apogee and perigee position of Jupiter, and the relative positions of other planets creating tidal bulges on the sun. And it may be that when the tidal effects are the greatest, you have a maximum output. In early May of 2000 there was a major planetary alignment (5 planets + moon as viewed from earth, within 26 degrees of one another) and solar output was at an unusually high maximum as compared to the sunspot level (which was lower than usual during the 11 year sunspot cycle). A nice graphic is available on wikipedia HERE. Other planetary alignments have been taking place over the last several years, in what appears to be a much higher frequency than at other times, and it will continue (supposedly there's one in 2012, but I couldn't find it with celestia) for a few more years until the planets happily go about their merry 'unaligned' way. And because of this NATURAL CYCLE, the solar output is higher than usual, and will remain higher than usual for several more years.
I used 'celestia' to snapshot a few planetary alignments. These show interesting alignments that are about 10 years apart.
May 10, 2000 January 25, 2010 July 2, 2020
Now we can all expect that those in the 'global warming' crowd are going to want to TAKE CREDIT for the obvious cooling pattern that WILL BEGIN within a decade or so, due (as I believe) to the lower frequency of planetary alignments and their relative arrangement to the Earth's apogee and perigee. Those environmentalist wack-jobs (aka man-made global warming fascists) WANT to have all of their ridiculous legislation passed AND ENFORCED for the simple reason that they will want to USE THIS AS "EVIDENCE" that their policied "WORKED" (when in fact it is clearly obvious to those of us with open enough minds that natural cycles are the only thing changing global temperature). So keep in mind that it's 2010 right now when I'm writing this. If what I say is true, you know I said it before it happened, and I used SCIENCE to predict the outcome! Sure, it's a theory, and this is my experiment, to prove or disprove it. We'll just wait and see. Publications and Commentary Global Warming Primer, National Center for Policy Analysis Relevant points and counter-points
Page 4: "Greenhouse gases are a small part of the Earth's atmosphere. However, they are critical to making the planet habitable - keeping the Earth from being a freezing rock in space like Mars."
This is purely ridiculous. Mars is a 'freezing' rock because it has a solid planet core, which caused the magnetic field to disappear, and SOLAR WINDS stripped Mars' atmosphere. It is also further from the Sun, so obviously it will be COLDER. On the other side of the planetary spectrum, Venus is a HOTHOUSE because it has SULFURIC ACID in its atmosphere (forming a blanket of clouds), no liquid water, and is SIGNIFICANTLY CLOSER to the Sun.
Page 6: "CO2 and other trace gases are only 5 percent of the greenhouse gases in the atmosphere. Water vapor makes up the other 95 percent."
Not only that, but the infrared absorption spectrum of water (20 times as much of it, don't forget) is at LEAST 10 times more than that of CO2, for an effective delta of (ka-ching) 200 times as much! And water vapor concentration in the atmosphere (say 'humidity') varies radically from one day to the next. Yet our planet's temperature does NOT vary radically from day to day. Go figure.
Page 7; "Humans contribute approximately 3.4 percent of annual CO2 emissions."
Thank you for admitting this!
"However, small increases in annual CO2 emissions, whether from humans or any other source, can lead to a large CO2 accumulation over time because CO2 molecules can remain in the atmosphere for more than a century."
WRONG! CO2 is at EQUILIBRIUM with dissolved CO2 in the ocean! So, if CO2 concentration goes UP in the atmosphere, excess CO2 will be stripped out by rain and accumulate as carbonates. If you don't believe me, bubble air through distilled water for a while and then measure its pH. Guess where the acidity came from? You guessed it! The CO2 in the air you bubbled through the water! Rain does the same thing.
Page 9: "There was an explosion of life forms 550 million years ago (Cambrian Period), when CO2 levels were 18 times higher than today."
With THIS news, I'd be all FOR increasing CO2 concentrations in the atmosphere. Explosion of LIFE! That's a GOOD thing.
Page 10: "During the time dinosaurs roamed the Earth, the average temperature was about 18 �F (10 �C) warmer than it is today."
These guys are making the case for WANTING global warming.
Page 11: "Over long periods of time, there is no close relationship between CO2 levels and temperature."
I'm starting to LIKE these guys!
Page 13: "For the past 400,000 years, temperature and CO2 levels have varied together. However, the Earth's temperature has consistently risen and fallen hundreds of years prior to increases and declines in CO2 levels."
The rising and falling of CO2 levels can easily be explained when you look at equilibrium calculations and the effect of temperature on the solubility of CO2 in the oceans: As temperature rises, CO2 solubility goes DOWN. This causes an increase in measured atmospheric CO2 levels, particularly in the vicinity of volcanos and high geothermal activity. The opposite is also true, so during an ice age you would expect low CO2 levels since more CO2 is kept dissolved in the earth's oceans.
Page 14: "During Roman and medieval times, the Earth was as warm as or warmer than it is today. A 'little ice age' began in the 1300s and ended in the mid-1800s."
Yes, it DID, Brett! Yes... it... DID! OK, enough of that. Point is, the Earth didn't flood from polar ice caps melting 2000 years ago, and it's not going to NOW, either. Normal cycles happen, can't be controlled by humans, aren't caused by humans, and history PROVES it.
Page 15: "CO2 levels have been fairly constant for the last 10,000 years."
This is actually quite interesting. Obviously CO2 had NO EFFECT on temperature! But then again, WHERE you take the measurements will affect your results. If you're near UNDERWATER VOLCANIC ACTIVITY, for example, CO2 concentration will be significantly higher. So I beg to differ on the 'nearly constant' part, suggesting that measurements are either inconsistent or misleading due to a data set that does not represent the entire earth. "Largely due to human activities, including the burning of fossil fuels and deforestation,"
I seriously doubt it
"CO2 levels have risen approximately 35 percent since the beginning of the industrial revolution, with more than 80 percent of that rise occurring since 1950."
That's strange. If humans only affect 3.4 percent of the CO2 output, how can that POSSIBLY make a change of 80 percent in 60 years?
I call <insert profanity> on THIS one.
Keep in mind that WHERE you measure is important. Measuring near an area where recent geological activity is causing a 'warm zone' to appear in the oceans (like off of California maybe?) is going to give you skewed results that do not represent the entire Earth as a whole. You need data that accurately represents the normal distributions worldwide, and that would include 'way out in the middle of the ocean' as well on land and along the coastline of a heavily industrialized nation. As we all know, there are lies, there are DAMN lies, and there are statistics.
Page 16: "The Earth's average temperature has risen a little less than one degree Celsius over the past century."
OMG, it's a freaking DISASTER (not)
"Although almost half of this warming occurred before 1940, greenhouse gas emissions began to rise substantially only after the 1950s."
This data doesn't CORRELATE very well between CO2 and temperature, DOES IT?
Page 19: "Most reports focus on gross CO2 emissions. However, as much as 40 percent of U.S. human CO2 emissions are reabsorbed, primarily by vegetation."
And the rest of it? It's in the ocean, of course! Dissolved CO2 becomes carbonates, which will eventually precipitate out if the concentration ever gets too high. You know what LIMESTONE is, right? 'Nuff said.
Page 20: "We know very little about 75 percent of the factors that scientists believe influence global temperature."
This point needs no further commentary.
Page 23: "Many scientists worry that global warming will cause droughts, floods, hurricanes of greater intensity, coastal flooding and the extinction of species that cannot adapt to change. So far, these effects are not evident."
This just keeps getting better and better!
Page 24: "Sea levels have risen since the Earth began to come out of the last ice age. However, the rate of sea level rise since 1961, less than two-sixteenths of an inch annually, is far lower than the historic average."
I better sell off that beach front property in Nevada and Arizona. It doesn't look like any time soon that California will sink into the ocean due to GLOBAL WARMING
Page 30: "CO2 is like plant food and most plants evolved at times when CO2 levels were much higher than today. Laboratory results show that plants grow bigger and faster with increased levels of CO2."
Remember, I said this already about 'biological equilibrium' - if you INCREASE the addition rate of CO2 into the atmosphere, plants will GROW FASTER, causing the DEPLETION RATE of CO2 to INCREASE, forming a NEW EQUILIBRIUM LEVEL for both CO2 and plants. It's not the idiotic 'fragile system' idea that environmentalist wack-jobs try to portray, now is it?
Page 31: "Most laws and treaties proposed to prevent, reduce or slow global warming would be expensive and do little to prevent warming or future harms. For a fraction of the costs, we could prevent much more harm and benefit many more people by adapting to a warmer world."
I couldn't agree MORE!
You ARE encouraged to READ THIS FOR YOURSELF. A Possible MOTIVATION Behind 'Man Made Global Warming' After much thinking about this issue, I have often considered the possibility that the entire 'Man Made Global Warming' issue exists NOT because the people behind the scenes actually BELIEVE in this pseudo-science, but rather are attempting to bring about some kind of change. Either society itself, or the world's political/economic state isn't what they envision it to be, and they fabricated the 'Man Made Global Warming' issue as a kind of crowbar to throw into the world economic engine in order to make it all happen their way. This makes a LOT of sense if you read between the lines. And there are a number of people who benefit from this kind of thing. There are many good reasons to make changes, and many sinister reasons as well. But it's still the kind of 'manipulation' that only the fearful would do. And above all other reasons, it is most likely FEAR that drives it. The Kyoto Protocol was an obvious ploy into forcing the United States to stop being the economic leader that it has been since World War II. Unfortunately many policies have apparently been enacted to this end, and our current situation as an economic leader is rather tenuous at the moment, all thanks to government policies. There are people out there that believe that LOWERING the United States' economic influence will somehow ELEVATE everyone else. What they fail to see of course is that a rising tide DOES lift ALL boats. They see economics as a zero-sum game where one person 'having' means someone else must 'have not'. But of course this MARXIST idea is just NOT true. Flowing money makes everyone who touches it better off. Oppressing one country, like the United States, will cause WORLDWIDE lowering of economic status, because it causes STAGNATION of the flow of money, and eventually results in a worldwide economic recession (or even depression). Still, there may be OTHER politically based motives, which may actually seem helpful. Right now the entire world is depending upon oil that is being pumped out of the Middle East. And PARTIALLY as a result of all of the money flowing into this region, we have well-funded terrorists committing 'crimes of terror' all over the world. Using 'Man Made Global Warming' as a crowbar into the current energy usage patterns of industrialized nations, you COULD force the invention of other sources of energy (such as hydrogen fusion) as well as the development of electric vehicles that would effectively SHUT OFF THE FLOW OF MONEY to this region of the world. It might be a way to combat terrorism! But if this is the case, WHY LIE ABOUT IT? Lying about something in order to do it 'for our own good' is blatently dishonest, and the KIND of MANIPULATIVE SINISTER BEHAVIOR that 'those in power' have often exhibited for centuries. They deny the fact that people are basically intelligent and tend to make CORRECT choices whenever they are presented with enough information to become INFORMED. Instead, these people whip up frenzy using EMOTION and never really solve anything. Such people must think that everyone else (but them) are idiots. The bottom line is that WHOEVER is behind the 'Man Made Global Warming' facade should simply come forward and state what the agenda REALLY is. If these people truly believe that the results of their agenda is better for everyone in the world, let them address the United Nations and plead their case, and allow questions and commentary and debate to follow. But using EMOTION to displace LOGIC, and 'whipping people up into a frenzy' to cause mass hysteria to drive their agenda forward, is the kind of SINISTER MANIPULATIVE EVIL CORRUPT OVERLORDING that all too often characterizes evil leaders throughout history. Lowering down those who have climbed highest up the ladder of success can only benefit those who are at the very top, and those who are at the very bottom. Those in the middle who are doing their best to get ahead find themselves frustrated by obstacle after obstacle. Having someone tell you that you can NOT climb past a certain rung, and you will be PUNISHED if you try, is only going to create a kind of 'clog' on the ladder. But those at the very bottom (who choose NOT to climb) and those ALREADY at the top, will benefit in several ways, not the least of which is that NOBODY ELSE will reach the top (meaning those already there have MORE power and influence and retain it indefinitely), and those at the bottom get to reap the 'freebies' (wealth re-distribution) that elevates them just enough to keep them from rioting. Still, the ones at the very top benefit the most. They're keeping 'the rest of us' from taking over their exclusive little 'country club', after all. Those who are ALREADY AT THE TOP are sometimes called 'Old Money'. Yes, they're SNOBS. They're like an economic NOBILITY of sorts, and they don't want to lose their inherited power. Those at the bottom are sometimes 'the unfortunate', but usually 'the lazy'. And they're often used by 'Old Money' to further their agenda. It makes you want to feel sorry for those at the bottom, but giving them MORE helps nobody. Freedom helps EVERYBODY. That's what we need to give them: MORE FREEDOM. And the 'Man Made Global Warming' agenda is anything BUT freedom.
And I go into a lot MORE HERE. And HERE. Movie: Socialist Environmentalist Phallusy Recently I experimented with a 'robotic' movie maker, with what I might call 'ok' results. Originally it was a simple response to a much shorter work (done by someone else) that attempted to make the 'Tea Party' people look like vacuous idiots. I (and others) thought that the concept of 'robot' movies based entirely on text input were good, but the politics were questionable at best. So I decided to make one of my own, having some spare time on Christmas Eve, 2010. I had hoped that it would be a somewhat 'darkly comedic' look at what life would be like in 2014 if the Tea Party elections of 2010 fail to cause reform, and if Obama gets re-elected in 2012 and THEN gets what he REALLY wants. You can view it HERE (flash video). Again, THINK FOR YOURSELF! Please!!!
THINK FOR YOURSELF
recently updated, 2/13/2013
http://www.mrp3.com/bobf/global_warming.html IP: Logged |
Randall
Webmaster Posts: 37528
From: Saturn next to Charmainec
Registered: Apr 2009
|
posted February 10, 2014 07:01 AM
(CNSNews.com) � Dr. Don Easterbrook � a climate scientist and glacier expert from Washington State who correctly predicted back in 2000 that the Earth was entering a cooling phase � says to expect colder temperatures for at least the next two decades.
Easterbrook�s predictions were �right on the money� seven years before Al Gore and the United Nation�s Intergovernmental Panel on Climate Change (IPCC) shared the 2007 Nobel Peace Prize for warning that the Earth was facing catastrophic warming caused by rising levels of carbon dioxide, which Gore called a �planetary emergency.��When we check their projections against what actually happened in that time interval, they�re not even close. They�re off by a full degree in one decade, which is huge. That�s more than the entire amount of warming we�ve had in the past century. So their models have failed just miserably, nowhere near close. And maybe it�s luck, who knows, but mine have been right on the button,� Easterbrook told CNSNews.com. �For the next 20 years, I predict global cooling of about 3/10ths of a degree Fahrenheit, as opposed to the one-degree warming predicted by the IPCC,� said Easterbrook, professor emeritus of geology at Western Washington University and author of 150 scientific journal articles and 10 books, including �Evidence Based Climate Science,� which was published in 2011. (See EasterbrookL coming-century-predictions.pdf) In contrast, Gore and the IPCC�s computer models predicted �a big increase� in global warming by as much as one degree per decade. But the climate models used by the IPCC have proved to be wrong, with many places in Europe and North America now experiencing record-breaking cold. Easterbrook noted that his 20-year prediction was the �mildest� one of four possible scenarios, all of which involve lower temperatures, and added that only time will tell whether the Earth continues to cool slightly or plunges into another Little Ice Age as it did between 1650 and 1790. �There�s no way to tell �til you get there,� he told CNSNews.com. But he lamented the fact that governments worldwide have already spent a trillion dollars fighting the wrong threat. �How does it feel to have been right?� CNSNews.com asked Easterbrook. �To be really truthful, it�s wonderful. There�s nothing that makes you feel better than to be right and be able to say, �I told you so,�� replied Easterbrook, who was also an official reviewer of the IPCC reports. �But I�m not gloating about it because it�s not good news. It�s bad news. �And in many respects, I hope that I�m wrong. And the reason I hope that I�m wrong is because it�s going to cost several million people their lives if I�m right. In Third World countries where food and water are a problem right now, it�s going to get worse. Cold is way worse for humanity than warm is.� Easterbrook said he made his earlier prediction by tracing back �a consistently recurring pattern� of alternating warm and cool ocean cycles called the Pacific Decadal Oscillation (PDO) that occurs naturally every 25 to 30 years. He discovered that the PDO corresponded with a similar temperature cycle demonstrated by isotope ratios found in Greenland ice cores going all the way back to 1480. �We don�t know what the driving mechanism is, but it�s very consistent. It�s happened five times a century and every time it�s happened, there�s been a corresponding change in global temperature, either warm or cool,� Easterbrook told CNSNews.com. �What I did was I projected this same pattern forward to see what it would look like. And so in 1999, which was the year after the second warmest year on record, the PDO said we�re due for a climate change, and so I said okay. It looks as though we�re going to be entering a period of about three decades or so of global cooling. �And so in 2000, I published a paper with the Geological Society of America in which I predicted that we were going to stop warming and begin cooling for about 25 or 30 years, on the basis of taking the temperature records that go back a century or more and simply repeating the pattern of warming and cooling, warming and cooling, and so on. �And that in fact has happened. We have now had 17 years with no global warming and my original prediction was right so far. But we have still probably another 20 years or so to see if the cooling trend continues, and if it does, then my prediction will be right and my methods will be right. And so what it boils down to is, so far so good.� Easterbrook added that his long-term prediction until the end of century is �a lot more nebulous� due to the still-unknown effect of the sun, which has entered a �grand solar minimum� occurring every 200 years. �Everything we think depends on what�s going to happen with the sun.� But based on past climate data, he says the most likely scenarios are �either deep cooling, or a return to another 25-year cycle of light warming/cooling, but nothing even approaching the 10 degrees warming the IPCC folks are predicting.� When CNSNews.com asked Easterbrook if anybody from the IPCC, which �ignored all the data I gave them,� ever admitted that he had been right, he laughed.�No, every time I say something about the projection of climate into the future based on real data, they come out with some modeled data that says this is just a temporary pause, like a tiger waiting under the rug.� Easterbrook noted that 32,000 American scientists have signed a statement that there�s no correlation between climate change and carbon dioxide levels. �I am absolutely dumbfounded by the totally absurd and stupid things said every day by people who are purportedly scientists that make absolutely no sense whatsoever�. �These people are simply ignoring real-time data that has been substantiated and can be replicated and are simply making up stuff,� he told CNSNews.com. Driven by a quest for money and power, he added, �what they�re doing in the U.S. is using CO2 to impose all kinds of restrictions to push a socialist government.� �One thing many people don�t realize is that CO2 by itself is incapable of causing significant climate change. Carbon dioxide in the atmosphere is 39/1,000ths of one percent. It�s nothing. Ninety-five percent of the greenhouse effect is water vapor, and water vapor is not changing. � �No doubt CO2 has been climbing, but the total change in atmospheric composition [since 1945, when CO2 levels began to increase] is one 9/1,000ths of one percent. So how are you going to have a 10 degree climate change by changing this tiny amount? You can�t do it,� he says, which is why the trillion dollars already spent worldwide on reducing carbon dioxide has had little effect. �The people who are climate deniers are the people who are denying global cooling," Easterbrook told CNSNews.com. "We haven�t had any global warming in 17 years, and they are denying that. And so we�re not the deniers. They�re the deniers.� - See more at: http://m.cnsnews.com/news/article /barbara-hollingsworth/climate-scientist-who-got-it-right-predicts-20-more-years-global#sthash.oqkUqHLK.dpuf IP: Logged |
Randall
Webmaster Posts: 37528
From: Saturn next to Charmainec
Registered: Apr 2009
|
posted February 10, 2014 07:20 AM
A veritable plethora of information on the bad science of global warming:
www.junkscience.com IP: Logged |
Randall
Webmaster Posts: 37528
From: Saturn next to Charmainec
Registered: Apr 2009
|
posted February 10, 2014 07:55 AM
Satellite data from three peer-reviewed journals disprove global warming theory:
http://www.americanthinker.com/2010/02/the_agw_smoking_gun.html IP: Logged |
Randall
Webmaster Posts: 37528
From: Saturn next to Charmainec
Registered: Apr 2009
|
posted February 10, 2014 07:59 AM
For any non-scientist interested in the climate debate, there is nothing better than a ready primer to guide you through the complexities of atmospheric physics � the �hardest� science of climatology. Here we outline the essential points made by Dr. Gerhard Gerlich, a respected German physicist, that counter the bogus theory of Anthropogenic Global Warming (AGW).Before going further, it�s worth bearing in mind that no climatologist ever completed any university course in climatology�that�s how new this branch of science really is. Like any new science the fall-back position of a cornered AGW proponent is the dreaded �appeal to authority� where the flustered debater, out of his or her depth, will say, �Well, professor so-and-so says it�s true � so it must be true.� Don�t fall for that proxy tree-ring counter�s gambit any longer. Here is the finest shredding of junk science you will ever read. In a recently revised and re-published paper, Dr Gerlich debunks AGW and shows that the IPCC �consensus� atmospheric physics model tying CO2 to global warming is not only unverifiable, but actually violates basic laws of physics, i.e. the First and Second Law of Thermodynamics. The latest version of this momentous scientific paper appears in the March 2009 edition of the International Journal of Modern Physics. The central claims of Dr. Gerlich and his colleague, Dr. Ralf Tscheuschner, include, but are not limited to: 1) The mechanism of warming in an actual greenhouse is different than the mechanism of warming in the atmosphere, therefore it is not a �greenhouse� effect and should be called something else. 2) The climate models that predict catastrophic global warming also result in a net heat flow from atmospheric greenhouse gasses to the warmer ground, which is in violation of the second law of thermodynamics. Essentially, any machine which transfers heat from a low temperature reservoir to a high temperature reservoir without external work applied cannot exist. If it did it would be a �perpetual motion machine� � the realm of pure sci-fi. Gerlich�s and Tscheuschner�s independent theoretical study is detailed in a lengthy (115 pages), mathematically complex (144 equations, 13 data tables, and 32 figures or graphs), and well-sourced (205 references) paper. The German physicists prove that even if CO2 concentrations double (a prospect even global warming advocates admit is decades away), the thermal conductivity of air would not change more than 0.03%. They show that the classic concept of the glass greenhouse wholly fails to replicate the physics of Earth�s climate. They also prove that a greenhouse operates as a �closed� system while the planet works as an �open� system and the term �atmospheric greenhouse effect� does not occur in any fundamental work involving thermodynamics, physical kinetics, or radiation theory. All through their paper the German scientists show how the greenhouse gas theory relies on guesstimates about the scientific properties involved to �calculate� the chaotic interplay of such a myriad and unquantifiable array of factors that is beyond even the abilities of the most powerful of modern supercomputers. The paper�s introduction states it neatly: (a) there are no common physical laws between the warming phenomenon in glass houses and the fictitious atmospheric greenhouse effects, (b) there are no calculations to determine an average surface temperature of a planet, (c) the frequently mentioned difference of 33 degrees Celsius is a meaningless number calculated wrongly, (d) the formulas of cavity radiation are used inappropriately, (e) the assumption of a radiative balance is unphysical, (f) thermal conductivity and friction must not be set to zero, the atmospheric greenhouse conjecture is falsified. This thorough debunking of the theory of man made warming disproves that there exists a mechanism whereby carbon dioxide in the cooler upper atmosphere exerts any thermal �forcing� effect on the warmer surface below. To do so would violate both the First and Second Laws of Thermodynamics. As there is no glass roof on the earth to trap the excess heat, it escapes upward into space.Thus we may conclude that the common sense axioms are preserved so that the deeper the ocean, the colder the water and heat rises, it does not fall. QED.
http://www.climategate.com/german-physicists-trash-global-warming-theory IP: Logged |
Randall
Webmaster Posts: 37528
From: Saturn next to Charmainec
Registered: Apr 2009
|
posted February 10, 2014 08:02 AM
Prominent atmospheric physicist, and former contractor for NASA�s Langley Research Center, Dr. Ferenc Miskolczi, has developed a new theory on CO2 and the �greenhouse� effect, one that is not being received well by warmers. Of course we know why it�s not received well, and that�s because he can prove that pumping CO2 into the atmosphere does not lead to catastrophic climate change.You see, Dr Miskolczi has discovered that the Earth is a lot smarter and a lot tougher than most give it credit. He says there is a self-regulating mechanism that keeps greenhouse gases in equilibrium, an equilibrium that is unaltered by CO2, methane or other atmospheric increases. Kirk Meyers at the Examiner.com reports: In simple terms, Miskolczi has discovered a new law of physics that sets an upper limit to the greenhouse effect. According to this law, the surplus temperature from greenhouse gases is constant and cannot be increased. Why? Because the earth�s greenhouse blanket functions dynamically to maintain equilibrium in response to changes in greenhouse gases such as water vapor, CO2, methane and ozone. Miskolczi says, �With relatively simple computations using NOAA�s annual mean temperature, H20 and CO2 time series, I have shown that in the last 61 years, despite a 30 percent increase in the atmospheric CO2 concentration, the cumulative atmospheric absorption of all greenhouse gases has not been changed and has remained constant. There is no runaway greenhouse effect. The anthropogenic global warming theory is a lie, unless somebody proves otherwise� Miskolczi had submitted his paper to the respected peer-review journal, Applied Optics, but his then employer, NASA contractor Analytical Services and Materials forced him to withdraw it. Miskolczi comments on this not uncommon problem: �My idea of freedom of science cannot coexist with the way NASA handles new climate-change-related scientific results.� There is much more of interest in this story, head over to the Examiner. This story seemed appropriate on the day the the NOAA opened the Climate Services propaganda site which makes no attempt to hide their belief that the science is settled. http://www.climategate.com/former-nasa-scientist-debunks-co2-greenhouse-theory IP: Logged |
Randall
Webmaster Posts: 37528
From: Saturn next to Charmainec
Registered: Apr 2009
|
posted February 10, 2014 08:08 AM
USA Today reports that US schools are finally calling for both sides of global warming to be taught, because it is after all, a theory � not a fact:The teaching of climate change is under attack in some U.S. public schools. This week, South Dakota�s Legislature passed a resolution calling for the �balanced teaching of global warming.� �Carbon dioxide is not a pollutant but rather a highly beneficial ingredient for all plant life,� says the resolution, which passed with mostly GOP votes. It also says global warming is �a scientific theory rather than a proven fact� and a variety of �astrological� and other �dynamics� affect weather.
http://www.climategate.com/schools-call-for-a-balanced-teaching-of-global-warming IP: Logged |
Randall
Webmaster Posts: 37528
From: Saturn next to Charmainec
Registered: Apr 2009
|
posted February 10, 2014 05:50 PM
Lots of great articles for those who have an open mind and who choose not to blindly listen to the doom and gloomers:
www.climategate.com IP: Logged |
Randall
Webmaster Posts: 37528
From: Saturn next to Charmainec
Registered: Apr 2009
|
posted February 10, 2014 06:07 PM
On Tuesday, a group of 50 international scientists released a comprehensive new report on the science of climate change that concluded that evidence now leans against global warming resulting from human-related greenhouse gas emissions. The report, which cites thousands of peer-reviewed articles the United Nations-sponsored panel on climate change ignored, also found that "no empirical evidence exists to substantiate the claim that 2�C of warming presents a threat to planetary ecologies or environments" and no convincing case can be made that "a warming will be more economically costly than an equivalent cooling." The U.N.'s panel is scheduled to release its next report next month. The Nongovernmental International Panel on Climate Change, or NIPCC, which produced the report, is described as "an international panel of scientists and scholars who came together to understand the causes and consequences of climate change." Unlike the "United Nations� Intergovernmental Panel on Climate Change (IPCC), which is government-sponsored, politically motivated, and predisposed to believing that climate change is a problem in need of a U.N. solution," NIPCC "has no formal attachment to or sponsorship from any government or governmental agency" and is "wholly independent of political pressures and influences and therefore is not predisposed to produce politically motivated conclusions or policy recommendations." In Climate Change Reconsidered II: Physical Science, which The Heartland Institute published and released on Tuesday, lead authors Craig D. Idso, Robert M. Carter, and S. Fred Singer worked with a team of scientists to produce a 1,200-page report that is "comprehensive, objective, and faithful to the scientific method." They found that even "if the concentration of atmospheric carbon dioxide were to double," whatever "warming may occur would likely be modest and cause no net harm to the global environment or to human well-being." Breitbart News obtained a detailed summary of the report's key findings. The report rebuts the alarmist reports put out by the United Nations' IPCC, which the authors claim are in "contradiction of the scientific method" because the IPCC assumes that its implicit hypothesis that "dangerous global warming is resulting, or will result, from human-related greenhouse gas emissions" is correct and "that its only duty is to collect evidence and make plausible arguments in the hypothesis�s favor. According to the study's authors, "the hypothesis of human-caused global warming comes up short not merely of 'full scientific certainty' but of reasonable certainty or even plausibility. The weight of evidence now leans heavily against the theory." The U.N.'s IPCC's first key claim is that "a doubling of atmospheric CO2 would cause warming between 3�C and 6�C." The study's authors, though, conclude that the "IPCC ignores mounting evidence that climate sensitivity to CO2 is much lower than its models assume." The NIPCC study discovered that warming actually "ceased around the end of the twentieth century and was followed (since 1997) by 16 years of stable temperature." The IPCC also claims in its reports that "CO2 caused an atmospheric warming of at least 0.3�C over the past 15 years." The lead authors of the report, though, found that the IPCC used incomplete climate models in their research. In fact, the NIPCC's authors found that "no excess warming has been demonstrated." The IPCC also asserts that a "thermal hot spot should exist in the upper troposphere in tropical regions" even though "observations from both weather balloon radiosondes and satellite MSU sensors show the opposite." Furthermore, the IPCC also asserts that "both polar regions should have warmed faster than the rest of Earth during the late twentieth century" when, in fact, "the large polar East Antarctic Ice Sheet has been cooling since at least the 1950s." The authors write that the United Nations panel has made "climate change into a political issue long before the science was sufficiently advanced to inform policymakers" and that "most government signatories to the UN�s Framework Convention on Climate Change have deferred to the monopoly advice of the IPCC in setting their national climate change policies." "More than 20 years down the track, it is now evident this approach has been mistaken," they write. "One result has been the expenditure of hundreds of billions of dollars implementing energy policies that now appear to have been unnecessary, or at least ill-timed and ineffective." NIPCC's findings "point toward several policy recommendations quite different from those that have come from the IPCC and its related agencies, bureaus, and commissions at the United Nations," and they include: taking into account "long-term trends" in climate science; seeking out advice from "independent, nongovernment organizations and scientists who are free of financial and political conflicts of interest"; allowing individual nations to "take charge of setting their own climate policies based upon the hazards that apply to their particular geography, geology, weather, and culture"; and recognizing "the theoretical hazard of dangerous human-caused global warming is but one small part of a much wider climate hazard," which is as much a "geological as it is a meteorological issue." The study's authors conclude that "atmospheric carbon dioxide (CO2) is a mild greenhouse gas that exerts a diminishing warming effect as its concentration increases" and even "doubling the concentration of atmospheric CO2 from its pre-industrial level, in the absence of other forcings and feedbacks, would likely cause a warming of ~0.3 to 1.1�C, almost 50% of which must already have occurred." Further, the study found that "a few tenths of a degree of additional warming, should it occur, would not represent a climate crisis" because, over recent geological time, the earth's "temperature has fluctuated naturally between about +4�C and -6�C with respect to twentieth century temperature. A warming of 2�C above today, should it occur, falls within the bounds of natural variability." Even if a future warming of 2�C occurs, the authors observe that though it "would cause geographically varied ecological responses, no evidence exists that those changes would be net harmful to the global environment or to human well-being" because the "current level of ~400 ppm" proves that "we still live in a CO2-starved world. Atmospheric levels 15 times greater existed during the Cambrian Period (about 550 million years ago) without known adverse effects." In addition, the earth "has not warmed significantly for the past 16 years despite an 8% increase in atmospheric CO2, which represents 34% of all extra CO2 added to the atmosphere since the start of the industrial revolution."
The U.N.'s IPCC continues, though, to postulate that "increases in atmospheric CO2 precede, and then force, parallel increases in temperature"; "solar forcings are too small to explain twentieth century warming"; and "a future warming of 2�C or more would be net harmful to the biosphere and human well-being." And the IPCC cites circumstantial evidence to support its global warming alarmism. Such evidence include an "unusual melting" that is occurring in mountain glaciers, Arctic sea ice, and polar icecaps," rising global sea levels, an increase in "droughts, floods, and monsoon variability and intensity," more intense "wildfires, rainfall, storms, hurricanes, and other extreme weather events," and an "unusual melting of Boreal permafrost or sub-seabed gas hydrates is causing warming due to methane release." The report dismisses these claims with peer-reviewed evidence and concludes that "neither the rate nor the magnitude of the reported late twentieth century surface warming (1979�2000) lay outside normal natural variability," "solar forcings of temperature change are likely more important than is currently recognized, and evidence is lacking that a 2� C increase in temperature (of whatever cause) would be globally harmful." "We conclude no unambiguous evidence exists for adverse changes to the global environment caused by human-related CO2 emissions," the authors write. "In particular, the cryosphere is not melting at an enhanced rate; sea-level rise is not accelerating; no systematic changes have been documented in evaporation or rainfall or in the magnitude or intensity of extreme meteorological events; and an increased release of methane into the atmosphere from permafrost or sub-seabed gas hydrates is unlikely." The authors also note that "forward projections of solar cyclicity imply the next few decades may be marked by global cooling rather than warming, despite continuing CO2 emissions" and warn against using imperfect deterministic climate models to advocate for a "one size fits all" climate policy. In light of these findings, which are "stated plainly and repeated in thousands of articles in the peer-reviewed literature" that are not "fringe," the authors emphasize that policymakers "should resist pressure from lobby groups to silence scientists who question the authority of the IPCC to claim to speak for 'climate science.'"
http://www.breitbart.com/Big-Government/2013/09/16/PLS-HOLD-FOR-TUESDAY-9-17-AFTER-11AM-ET-Climate-Study-Evidence-Leans-Against-Human-Caused-Global-Warming IP: Logged |
AcousticGod
Knowflake Posts: 8437
From: Dublin, CA
Registered: Apr 2009
|
posted February 11, 2014 12:27 PM
quote:
Actually, there are many scientific journal articles that have been published on the other side. You refuse to acknowledge them...or any expert in their scientific field unless they work for the IPCC or NOAA.
There isn't. As we've discussed previously study after study looks at all available scientific papers on the climate, and regularly find minimal suggestion against the grain. These studies start with Oreskes (2004) proceeding through Doran 2009 and Anderegg et al (2010) to most recently this: http://www.theguardian.com/environment/climate-consensus-97-per-cent/2013/may/16/climate-change-scienceofclimatechange Scientific entities that take this stance: Scientific organizations endorsing the consensus
The following scientific organizations endorse the consensus position that "most of the global warming in recent decades can be attributed to human activities":
- American Association for the Advancement of Science
- American Astronomical Society
- American Chemical Society
- American Geophysical Union
- American Institute of Physics
- American Meteorological Society
- American Physical Society
- Australian Meteorological and Oceanographic Society
- Australian Bureau of Meteorology and the CSIRO
- British Antarctic Survey
- Canadian Foundation for Climate and Atmospheric Sciences
- Canadian Meteorological and Oceanographic Society
- Environmental Protection Agency
- European Federation of Geologists
- European Geosciences Union
- European Physical Society
- Federation of American Scientists
- Federation of Australian Scientific and Technological Societies
- Geological Society of America
- Geological Society of Australia
- Geological Society of London
- International Union for Quaternary Research (INQUA)
- International Union of Geodesy and Geophysics
- National Center for Atmospheric Research
- National Oceanic and Atmospheric Administration
- Royal Meteorological Society
- Royal Society of the UK
But we're supposed to believe you know better than all of this. That just blows me away that you could possible think this way. And what of my logical statement about everyone being incapable of lying in unison? Do you dare tackle that? Do you disagree that people love to expose the truth from the inside? Do you disagree that people, especially a scientist with an agenda, would jump at the opportunity to expose this whole supposed conspiracy? Basic human nature 101. You're quoting me Geocraft, which is a website operated by climate nobody Monte Heib, an employee at the West Virginia Office of Miner�s Health, Safety, and Training. What's worse is that he chose to put up a quote from Fred Singer, who is the go-to guy if you want to try to sell some pseudo science, whether it be that tobacco smoke is harmless, or that the warming didn't come from man. He also posts a quote from Dr. Wallace Broecker, which is REALLY silly considing:
 http://thinkprogress.org/climate/2011/08/12/286706/wallace-broecwallace-broecker-1975-global-warming-prediction/ http://thinkprogress.org/climate/2011/08/12/286706/wallace-broecwallace-broecker-1975-global-warming-prediction/ I'm sorry, but Geocraft is not your credible scientific institution that's going to put the nail in the coffin. quote:
Straight from a climatologist: http://pubs.acs.org/subscribe/journals/ci/31/special/may01_viewpoint.html
Not a climatologist. A mechanical engineer who specializes in combustion.
PublicationsA search of 22,000 academic journals shows that, Essenhigh has published over 45 peer-reviewed research articles mainly in the area of combustion. According to a search of Google Scholar, Essenhigh has published two articles in the area of climate change in a peer-reviewed journal. One of these publications was published in the journal Energy And Environment, a journal edited by climate change skeptic Sonja Boehmer-Christiansen. E&E has been criticized for its peer-review process, and has been one of the main journals willing to published articles by climate change skeptics. His other publication is in Energy Fuels, a publication of the American Chemical Society, an organization that has been accused of editorial bias due to its strong ties with industry. http://www.desmogblog.com/robert-h-essenhigh
His students say it best, though: http://www.ratemyprofessors.com/ShowRatings.jsp?tid=313631 (I know you'll like this since "truth" can come from anywhere.)
He also made the list of questionable appearances in Inhofe's scientific backing:
quote:
THINK FOR YOURSELFrecently updated, 2/13/2013 http://www.mrp3.com/bobf/global_warming.html
You trust a site with a blue and white cloud background for your scientific information? Really? This is the most professional thing you can find to post? From the article:
But their so-called "research" is based on flawed logic. Not only does it assume that MAN MADE CO2 is "the problem" it also assumes that CO2 is the ONLY so-called "greenhouse gas" on the planet, AND that man-made CO2 is the primary driving force for "global climate change". I've NEVER seen a climate scientist claim that CO2 is the ONLY "greenhouse gas" on the planet. That's absurd on it's face. How could you continue reading after that?
IP: Logged |
AcousticGod
Knowflake Posts: 8437
From: Dublin, CA
Registered: Apr 2009
|
 posted February 11, 2014 12:32 PM
quote:
(CNSNews.com) � Dr. Don Easterbrook � a climate scientist and glacier expert from Washington State who correctly predicted back in 2000 that the Earth was entering a cooling phase � says to expect colder temperatures for at least the next two decades.
Don Easterbrook's Heartland Distortion of Reality Posted on 7 June 2012 by dana1981 At the recent scandal-plagued Heartland climate conference, Don Easterbrook gave a presentation in which he discussed his previous predictions of global cooling. Given the inaccuracy of those predictions after just one decade, we were surprised to learn that Easterbrook had highlighted them in his talk, going as far as to claim that his global cooling projectons have thus far been more accurate than the global warming projections in the 2001 Intergovernmental Panel on Climate Change (IPCC) Third Assessment Report (TAR). However, to make this claim, Easterbrook had to distort the IPCC's actual model projections, claiming: "In fact the IPCC predicted in the year 2000 that we would be experiencing 1 degree increase in temperature between the year 2000 and 2010." As Skeptical Science readers are undoubtedly aware, and as we will show in greater detail below, this assertion is an outright falsehood. Distortions of the IPCC projections aside, was Easterbrook correct in his claim that his temperature predictions were more accurate than those in the TAR? As Figure 1 shows, the simple answer is no.

Figure 1: Easterbrook's two global temperature projections A (green) and B (blue) vs. the IPCC TAR simple model projection tuned to seven global climate models for emissions scenario A2 (the closest scenario to reality thus far) (red) and observed global surface temperature change (the average of NASA GISS, NOAA, and HadCRUT4) (black). Easterbrook vs. IPCC - Fantasy vs. Reality (<--Interesting choice of words as those are ones I often employ in these conversations) The IPCC TAR produced global temperature projections (not PREDICTIONS) based on a number of possible greenhouse gas emissions scenarios from their Special Report on Emission Scenarios (SRES). As we recently showed in our discussion of the 2011 International Energy Agency (IEA) CO2 emissions update, thus far actual emissions have most closely followed Scenario A2 from the SRES. Thus Figure 1 depicts the IPCC TAR Scenario A2 temperature projection based on a simple climate model which was tuned to the seven Atmosphere-Ocean General Circulation Models (AOCGMs). Over the first decade or two of the 21st Century, the IPCC projected close to 0.2�C surface warming per decade. Thus we were very curious to find out where Easterbrook had obtained the information that led him to assert that the IPCC had predicted a 1�C increase over the first decade of the century (see minute 6 in the video and the lower right panel in Figure 4 below). Easterbrook's depiction of the IPCC projection is quite unlike the report's actual model projections (Figure 2).

Figure 2: From IPCC TAR, historical anthropogenic global mean temperature change and future changes for the six illustrative SRES scenarios using a simple climate model tuned to seven AOGCMs. Also for comparison, following the same method, results are shown for IS92a. The dark blue shading represents the envelope of the full set of thirty-five SRES scenarios using the simple model ensemble mean results. The light blue envelope is based on the GFDL_R15_a and DOE PCM parameter settings. The bars show the range of simple model results in 2100 for the seven AOGCM model tunings. Source of the Distortion
A Skeptical Science contributor contacted Easterbrook to inquire as to the source of his depiction of the IPCC projections. Easterbrook responded that he had obtained them from the IPCC website, but that the data must have been subsequently altered or removed, because he could no longer find it. Tom Curtis did some sleuthing to try and find the source of Easterbrook's graphic, and it appears that he has identified it correctly as the HadCM3 temperature simulation in Figure 9.5 (a) G (Figure 3 below).

Figure 3: IPCC TAR Figure 9.5 (a) The time evolution of the globally averaged temperature change relative to the years (1961 to 1990) of the DDC simulations (IS92a). G: greenhouse gas only. The observed temperature change (Jones, 1994) is indicated by the black line. (Unit: �C). See Table 9.1 for more information on the individual models used here. In Figure 4, Tom Curtis has overlaid Easterbrook's depiction of the IPCC temperature projection onto the HadCM3 curve from Figure 3.
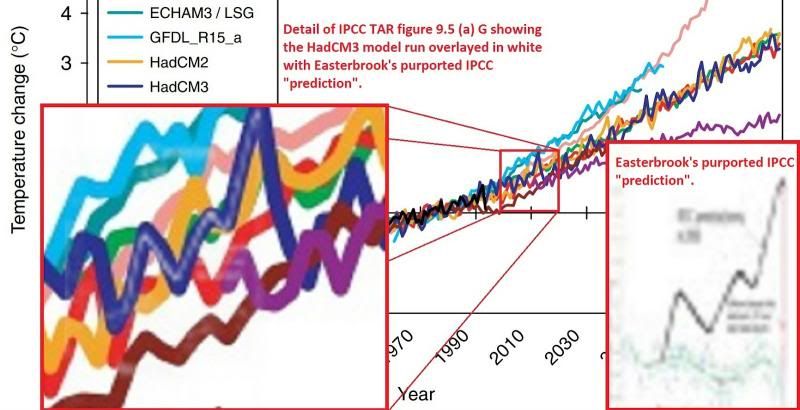
Figure 4: IPCC TAR Figure 9.5 (a) blown up for the timeframe 2000 to 2020 to illustrate Easterbrook's curve (gray) overlaid on the HadCM3 curve (dark blue). The two curves align almost perfectly from 2000 to 2011. The fundamental flaw in Easterbrook's graphic is outlined in the caption to Figure 3 above, which depicts individual model global temperature change simulations to greenhouse gas changes only, rather than simulations responding to changes in the total global radiative forcing (which the IPCC shows in Figure 2 above). On top of that, Easterbrook has selected a model run which happens to simulate a large temperature spike right around 2011, after which temperatures immediately fall and don't return to their 2011 levels for another 20 years. This anomalous temperature spike is due to the fact that Easterbrook relied on a single model simulation as opposed to the average of a number of simulations. After some more sleuthing, Tom Curtis discovered that Easterbrook had shown the same IPCC HadCM3 greenhouse gas-only model run at the 2010 Heartland conference, but in that case, he showed the entire curve (see minute 7:35 in this video, and Figure 5 below).

Figure 5: Don Easterbrook's global temperature graphic presented during the 2010 Heartland conference. During the 2012 Heartland conference, Easterbrook elected only to show the HadCM3 greenhouse gas-only forcing simulation data up to 2011, at the peak of its short-term temperature spike, exaggerating the supposed difference between models and data. Additionally, if you look closely at Figure 5, even in Easterbrook's own distorted IPCC presentation the largest minimum to maximum temperature difference in the first decade of the 21st century, if you exaggerate the change by cherrypicking the endpoints rather than calculating a statistical trend, is only about 0.6�C, not 1�C.
(Continued next post) IP: Logged |
Randall
Webmaster Posts: 37528
From: Saturn next to Charmainec
Registered: Apr 2009
|
posted February 11, 2014 01:32 PM
I am a rational person. Nothing you post will ever convince me that man's minuscule contribution to CO2 will in any way affect climate. You underestimate the power of money. There is no money in going against the green gravy train. IP: Logged |
AcousticGod
Knowflake Posts: 8437
From: Dublin, CA
Registered: Apr 2009
|
posted February 11, 2014 01:54 PM
What happened to my posts? There are at least two missing. I did conclude the above article, and I had done an additional post listing the reasonable things you can't seem to get over. I had even saved the above image to photobucket, because it initially posted too huge as it is now.IP: Logged |
AcousticGod
Knowflake Posts: 8437
From: Dublin, CA
Registered: Apr 2009
|
posted February 11, 2014 01:57 PM
I guess it's good that I saved my whole writing. It wouldn't post in one go, so I copied it to an email to parse out in individual posts.Continued from above: To summarize Easterbrook's distortions of the IPCC TAR temperature projections:
- He chose a figure which represented model simulations of temperature responses only to greenhouse gas changes, which neglects for example the temperature response to the cooling effects of aerosols.
- He chose a single model run with an anomalous temperature spike in 2011.
- He only presented the data from 2000 to 2011, which concealed the fact that the temperature spike in 2011 was a short-term anomaly.
- He exaggerated his distorted IPCC temperature rise by a factor of two.
Thus Easterbrook's claim that the IPCC TAR projected a 1�C global surface warming from 2000 to 2010 was not even remotely accurate. IPCC Beats Easterbrook
However, as we have previously discussed, the average global surface temperature over the first decade of this century has indeed warmed at a dampened rate. There are several reasons for this; for example, aerosol emissions have risen, there has been a preponderance of La Ni�a events at the end of this timeframe, there has been increased heat storage in the deep oceans, and there was also an extended solar minimum. Frankly with all of these effects acting in the cooling direction, it's amazing that surface temperatures continued to warm over the past decade, but they did. The average of the NASA GISS, NOAA, and HadCRUT4 global surface temperature data sets shows a 0.08�C warming from 2000 through 2011 (Figures 1 and 3). On the other hand, Easterbrook's two temperature projections showed a 0.2�C and 0.5�C cooling over this period, while the IPCC TAR Scenario A2 projection showed a 0.2�C warming (Figure 6).

Figure 6: Easterbrook's two global temperature projections A (green) and B (blue) vs. the IPCC TAR simple model projection tuned to seven global climate models for emissions scenario A2 (the closest scenario to reality thus far) (red) and observed global surface temperature change (the average of NASA GISS, NOAA, and HadCRUT4) (black) over the period 2000 through 2011. The IPCC TAR projection and the 1998-2002 average temperature anomaly are baselined to match Easterbrook's projections in 2000. So while the IPCC TAR projection was too high by about 0.12�C for the reasons discussed above, Easterbrook's projections were too low by 0.28�C and 0.58�C. Despite all of these non-greenhouse gas factors acting in the cooling direction over this timeframe, the IPCC projection was still much closer to reality than Easterbrook's. Continued in next post IP: Logged |
AcousticGod
Knowflake Posts: 8437
From: Dublin, CA
Registered: Apr 2009
|
posted February 11, 2014 02:05 PM
Climate Contrarian Distortions of Reality
Perhaps the most disturbing aspect of this presentation is the degree of misinformation and distortion of reality associated with it. Any climate scientist can immediately tell you that the IPCC projected approximately 0.2�C global surface warming over the first decade of the century - certainly nowhere near 1�C. Yet nobody at Easterbrook's presentation spoke up to correct the glaring mistake, which was central to his entire talk. There were few climate scientists present at the Heartland conference, but the fact that nobody caught or corrected Easterbrook's error speaks volumes about the lack of climate expertise and/or lack of interest in getting the facts right amongst the conference attendees.As a result, Heartland members are now touting Easterbrook's misinformation to a more mainstream audience, such as by Peter Ferrara at Forbes magazine. While a partisan policy analyst like Ferrara can perhaps be forgiven for deferring to a scientist like Easterbrook on scientific matters, somebody should have caught the error immediately before Ferrara had a chance to disseminate this misinformation. Additionally, Easterbrook should never have made this error to begin with. The caption of the IPCC figure he used was clear and explicit that it depicted model simulations responding to only the greenhouse gas forcing. Even if the graphic in question depicted responses to the total global radiative forcing, to cherrypick a single model run and ignore the fact that it displays an anomalous spike in 2011 reveals exceptionally poor data analysis on Easterbrook's part. The fact that such a glaring distortion of reality was presented at the Heartland conference (at least twice) without being corrected and was subsequently disseminated to a much larger audience by Heartland members reveals a distinct lack of true skepticism amongst the Heartland Institute and its conference attendees. http://www.skepticalscience.com/don-easterbrook-heartland-distortion-of-reality.html I do believe I am well-founded in sticking to a contrary view from yours. You mistake something that's not science for science. IP: Logged |
AcousticGod
Knowflake Posts: 8437
From: Dublin, CA
Registered: Apr 2009
|
posted February 11, 2014 02:17 PM
To summarize the post I posted after this article I pointed out major hurdles you should concede ground on:
- Plethora of real, non-political scientific entities that back my perspective (really, it's their perspective; I'm merely wondering why you think they're wrong)
- Dearth of real, non-political scientific entities that back your perspective (which, once again, isn't really your perspective per se)
- Award-winning-physicist Dr. Richard Mueller sets out to prove the manipulation or misinterpretation of the climate data only to find out that there is none
- Suppose worldwide conspiracy that lacks any insider whistle-blowers
Somehow instead of posting this, my posts disappeared, and you post claiming to be rational. You say, "Nothing you post will ever convince me..." That doesn't sound like something a rational person would say. Your own independent research can verify the contribution of CO2 to warming. I don't have to be a part of it, because there's plenty out there to refute this in the instance that you are actually open-minded enough to hear it. Moreover, with regard to rationality and your post:
You don't seem to want to deal with my common sense reasoning. Do you disagree that my position is informed by more agencies that monitor climate science? Do you disagree that there's a dearth of such agencies to back your position? Can you show that Dr. Richard Mueller is somehow on the take for his Conservative-sponsored independent review of the science? What do you have to say about the very nature of man, and how man's sense of justice LOVES to bring the truth to light? How can there be such a consensus when everyone (by your accounting) is lying? People hate liars.
IP: Logged |
AcousticGod
Knowflake Posts: 8437
From: Dublin, CA
Registered: Apr 2009
|
posted February 11, 2014 02:21 PM
Oh, I had included something from Dr. Mueller's website, too. It was an endorsement from Glen Beck no less who loved Dr. Mueller's book, except for the global warming part.I've been trying unsuccessfully to re-size that picture that is widening our screen. The forum is treating the post as too big to change, which is why I broke it up in the first place. I can remove the picture if we'd prefer. I think it's clear that Easterbrook's contention and charts were wrong. IP: Logged |
Randall
Webmaster Posts: 37528
From: Saturn next to Charmainec
Registered: Apr 2009
|
posted February 11, 2014 03:59 PM
I think it's clear that your IPCC and NOAA were wrong, since none of their dire predictions came true.IP: Logged |
AcousticGod
Knowflake Posts: 8437
From: Dublin, CA
Registered: Apr 2009
|
posted February 11, 2014 04:44 PM
I'll remind you of what I just posted in case you didn't read it:
So while the IPCC TAR projection was too high by about 0.12�C for the reasons discussed above, Easterbrook's projections were too low by 0.28�C and 0.58�C. Despite all of these non-greenhouse gas factors acting in the cooling direction over this timeframe, the IPCC projection was still much closer to reality than Easterbrook's. Of course, this isn't an example of a dire prediction. What's a dire event that was supposed to have happened by now according to the NOAA or IPCC? There is none, right? It's just supposed to be warmer from the increased CO2 emissions, correct? Here's an article about that: http://www.skepticalscience.com/ipcc-overestimate-global-warming-advanced.htm Are there more dire "predictions" that were supposed to have happened by now? IP: Logged |
Randall
Webmaster Posts: 37528
From: Saturn next to Charmainec
Registered: Apr 2009
|
 posted February 11, 2014 05:20 PM
If nothing is dire, then why bother? What's the alarm? Back-peddling much?IP: Logged | |
 Lindaland


 UBBFriend: Email This Page to Someone!